
Reason to trust
How Our News is Made
Strict editorial policy that focuses on accuracy, relevance, and impartiality
Ad discliamer
Morbi pretium leo et nisl aliquam mollis. Quisque arcu lorem, ultricies quis pellentesque nec, ullamcorper eu odio.
Bitcoin failed to continue above the $9,200 resistance and it is down more than 4% against the US Dollar. BTC is now trading in a bearish zone and it could slide further below $8,700.
- After forming a short term top near $9,211, bitcoin price declined sharply below $8,880.
- The price is now trading well below $9,000 and the 100 simple moving average (4-hours).
- There is a crucial bearish trend line forming with resistance near $9,122 on the 4-hours chart of the BTC/USD pair (data feed from Kraken).
- The pair is likely to extend its decline below the $8,700 and $8,600 levels in the near term.
Bitcoin Turns Bearish Again
This past week, bitcoin started a steady rise above the $8,700 and $8,880 resistance levels against the US Dollar. BTC price gained traction and it even managed to climb above the key $9,000 resistance.
However, the bulls faced a strong resistance near the $9,200 area and the 100 simple moving average (4-hours). There is also a crucial bearish trend line forming with resistance near $9,122 on the 4-hours chart of the BTC/USD pair.
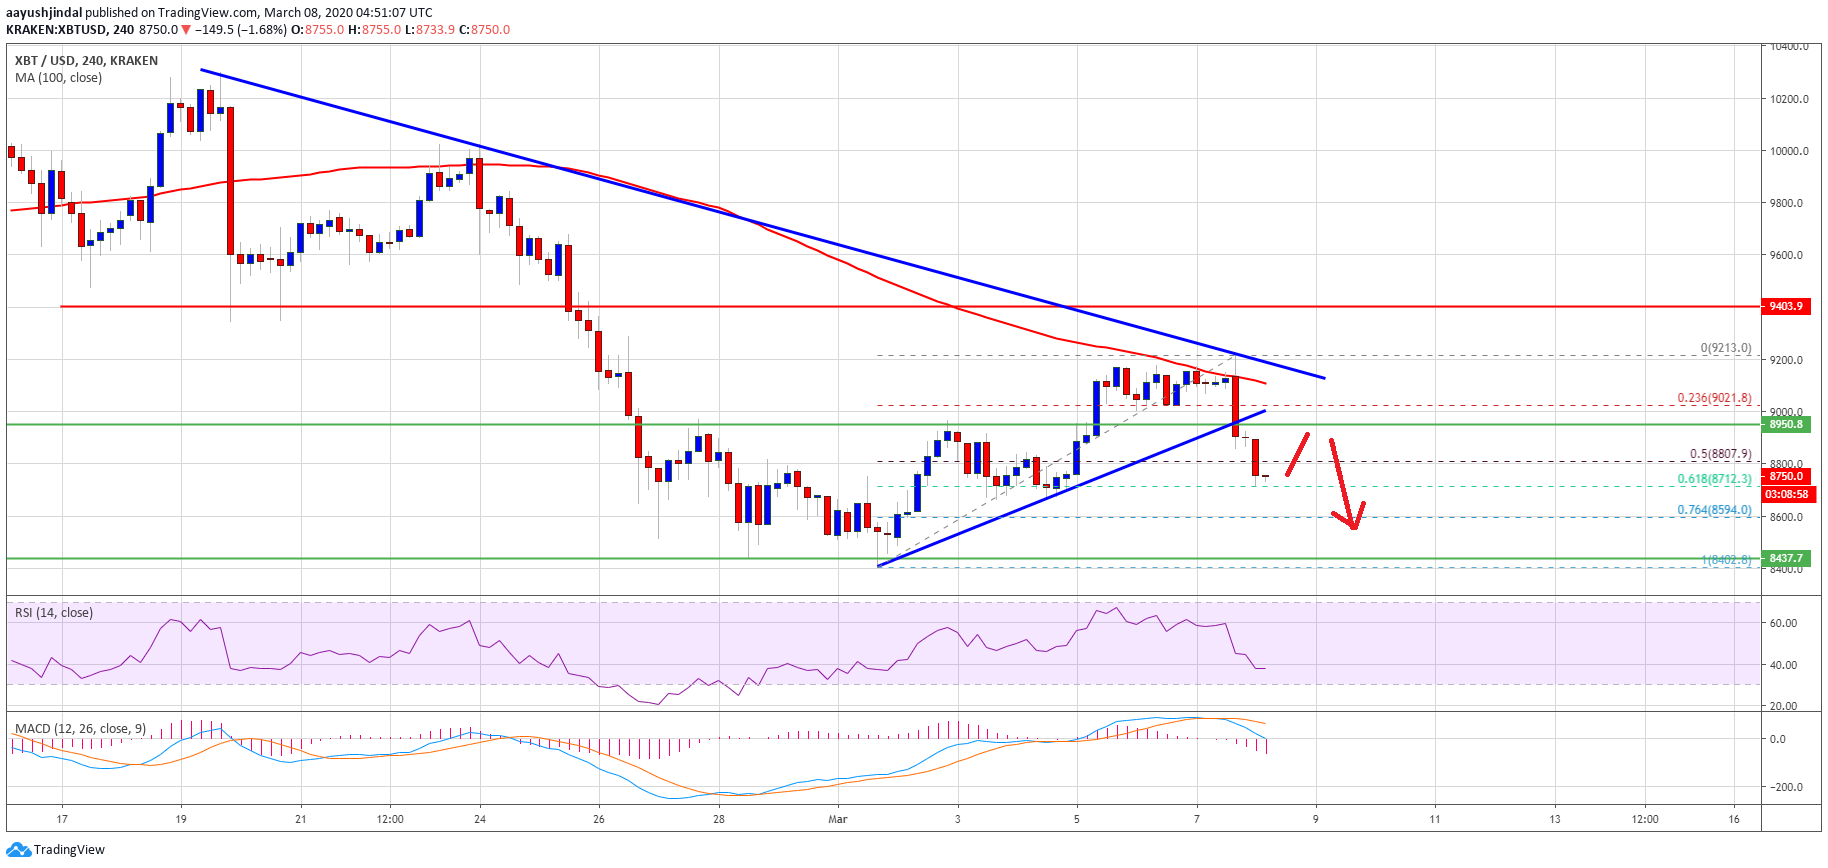
It seems like bitcoin failed to clear the trend line, $9,200, and the 100 SMA. As a result, there was a sharp decline below the $9,000 support level. The price is down around 4% and it even declined below the 50% Fib retracement level of the upward move from the $8,402 low to $9,212 high.
It is now trading below the $8,800 level and testing the 61.8% Fib retracement level of the upward move from the $8,402 low to $9,212 high.
If the bulls fail to protect the $8,700 support level, there is a risk of another decline. An initial support is near the $8,600 level, below which there is a risk of a drop towards the $8,400 support area.
Upside Correction
If the $8,700 support remains intact, bitcoin price might correct higher above $8,800. An initial resistance on the upside is near the $8,950 level, above which the bulls could aim a break above the trend line.
If there is a clear break above the trend line and the $9,200 resistance, the price might start a strong rally towards the $9,500 and $9,800 levels in the near term. Overall, the trend is now negative and the price might slide further towards $8,400.
Technical indicators
4 hours MACD – The MACD for BTC/USD is now gaining pace in the bearish zone.
4 hours RSI (Relative Strength Index) – The RSI for BTC/USD is now well below the 50 level.
Major Support Level – $8,800
Major Resistance Level – $9,200


