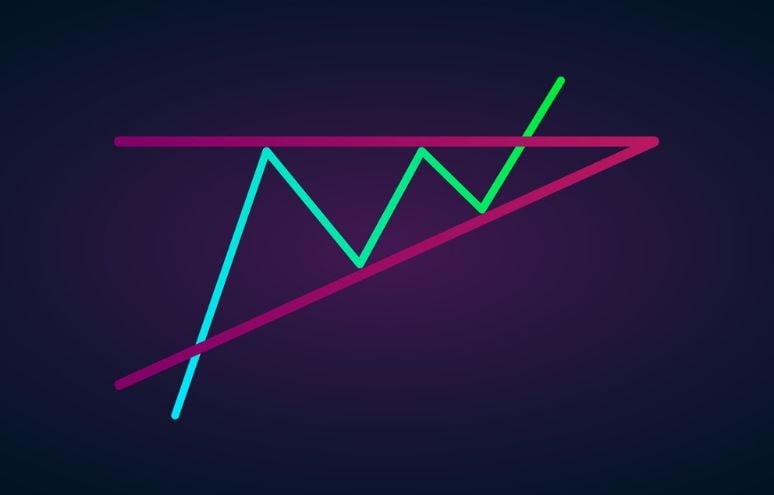
Triangles are bullish or bearish depending on the angle of the triangle.
Flat topped triangles with an ascending lower support line, are called an ascending triangle. Flat-bottomed triangles with a descending upper resistance line, are called descending triangles. Symmetrical triangles also exist, where the top and bottom trend lines converge to an apex.
Descending Triangle
Descending triangles are typically a bearish structure.
Bitcoin’s entire 2018 bear market was trapped in one giant descending triangle that ultimately broke down through support. The target of a descending triangle is taken by measuring the widest point of the triangle, and applying it to the breakout.
Bitcoin’s bottom target was reached perfectly according to the measure rule.
Ascending Triangle
Ascending triangles are the bullish counterpart to the descending triangle. A rising bottom support line eventually pushes price upward through strong resistance, causing a strong reaction.
Targets can be predicted by taking the widest point of the triangle and applying it to the breakout point. In the below example, after the target was reached, a strong new uptrend had formed.