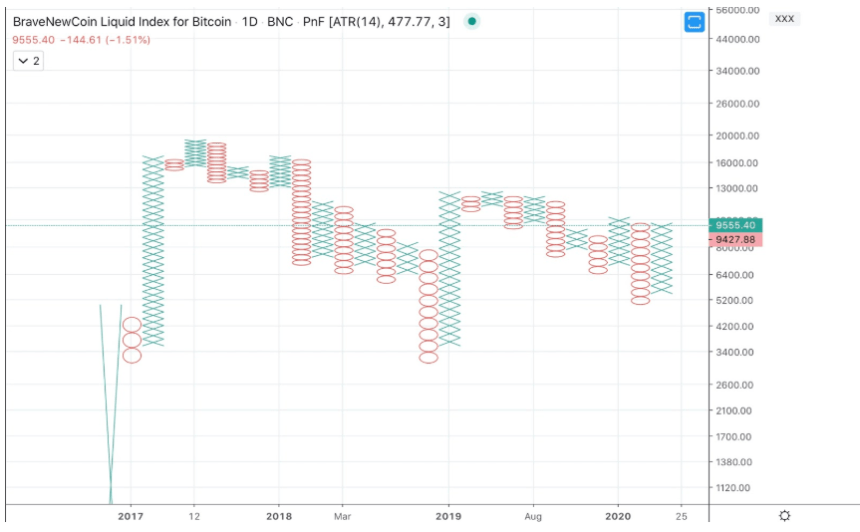
Point and figure charts are yet another unusual type of chart for analysis.
Point and figure charts do not factor price into each chart, but instead focuses on direction. The direction of the price action is filled with either Xs or Os, representing positive or negative price action.
Oftentimes, this type of chart is kept in an excel spreadsheet and not using traditional charting software.