Point and figure charts are yet another unusual type of chart for analysis.
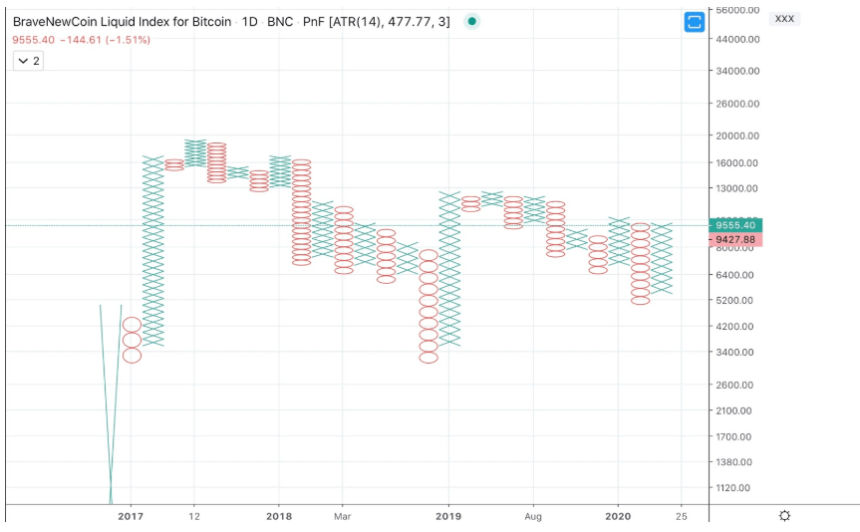
Point and figure charts do not factor price into each chart, but instead focuses on direction. The direction of the price action is filled with either Xs or Os, representing positive or negative price action.
Oftentimes, this type of chart is kept in an excel spreadsheet and not using traditional charting software.
Disclaimer: The article is provided for educational purposes only. It does not represent the opinions of NewsBTC on whether to buy, sell or hold any investments and naturally investing carries risks. You are advised to conduct your own research before making any investment decisions. Use information provided on this website entirely at your own risk.