Much like Renko changes the entire shape and formation of a candlestick chart, so does Kagi, another type of chart. Kagi is yet another type of chart designed by the Japanese.
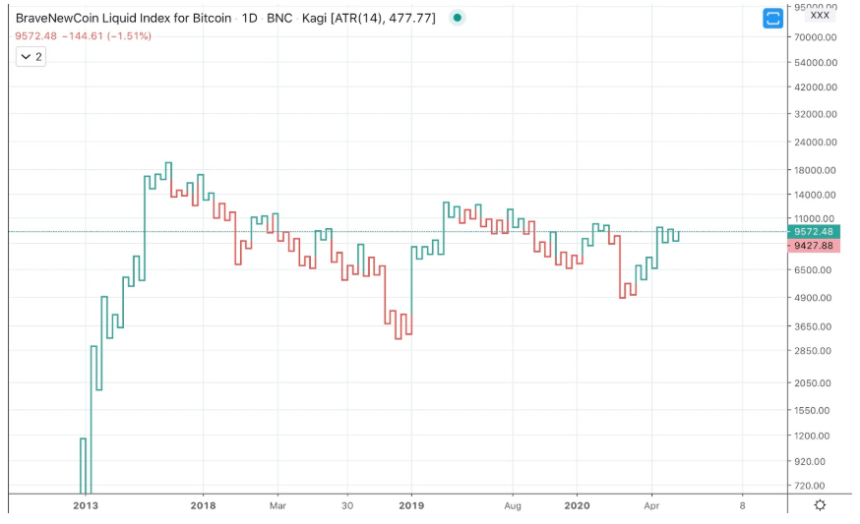
This type of chart utilizes a series of vertical lines referencing an asset’s price action. Each line moves horizontally with each close.
Kagi specifically omits time as a factor in chart analysis, also helping to reduce noise and give a clearer picture of trends.
Disclaimer: The article is provided for educational purposes only. It does not represent the opinions of NewsBTC on whether to buy, sell or hold any investments and naturally investing carries risks. You are advised to conduct your own research before making any investment decisions. Use information provided on this website entirely at your own risk.