Reason to trust
How Our News is Made
Strict editorial policy that focuses on accuracy, relevance, and impartiality
Ad discliamer
Morbi pretium leo et nisl aliquam mollis. Quisque arcu lorem, ultricies quis pellentesque nec, ullamcorper eu odio.
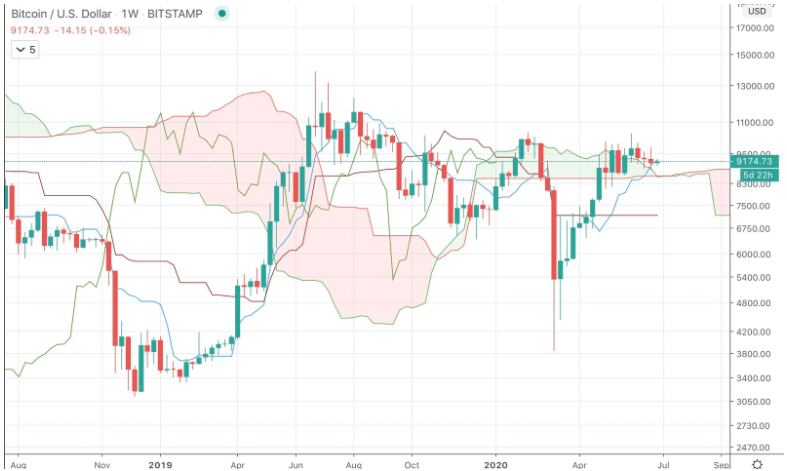
The Ichimoku Kinkō Hyō or Ichimoku Cloud for short, is a technical analysis indicator designed by Japanese journalist Goichi Hosoda. Ichimoku Kinko Hyo by loosely translates to “one glance equilibrium chart.”
Because the tool is designed to provide traders so much intel at a glance, it can be overwhelming to look at for novice traders. Even experienced traders often aren’t able to utilize the tool correctly due to so many moving parts. However, the tool can be an all-in-one solution as a result.
The Ichimoku indicator consists of the following unique tools:
- Tenkan-sen
- Kijun-sen
- Senkou Span A
- Senkou Span B
- Kumo
- Chikou Span
The Kumo or cloud is used to define support and resistance, and twists in the cloud can signal when and where potential reversals may take place. The height of the cloud is based on an asset’s volatility. The larger the cloud, the stronger the resistance or support it acts as.
Senkou Span A and Senkou Span B crossovers can also signal changes from bullish to bearish trends.
The Chikou Span or lagging span is plotted backwards and is used to depict where possible areas of support and resistance may lie.


