Reason to trust
How Our News is Made
Strict editorial policy that focuses on accuracy, relevance, and impartiality
Ad discliamer
Morbi pretium leo et nisl aliquam mollis. Quisque arcu lorem, ultricies quis pellentesque nec, ullamcorper eu odio.

There are a number of technical analysis tools designed to gauge the strength of a trend. The easiest to read tool for measuring trend strength, is the Average Directional Index.
The ADX typically also includes two Direction Movement Index lines and the ADX itself. When the two DI lines cross, it is a signal the trend is bearish or bullish, depending on the crossover. The ADX itself then measures the strength of the trend itself.
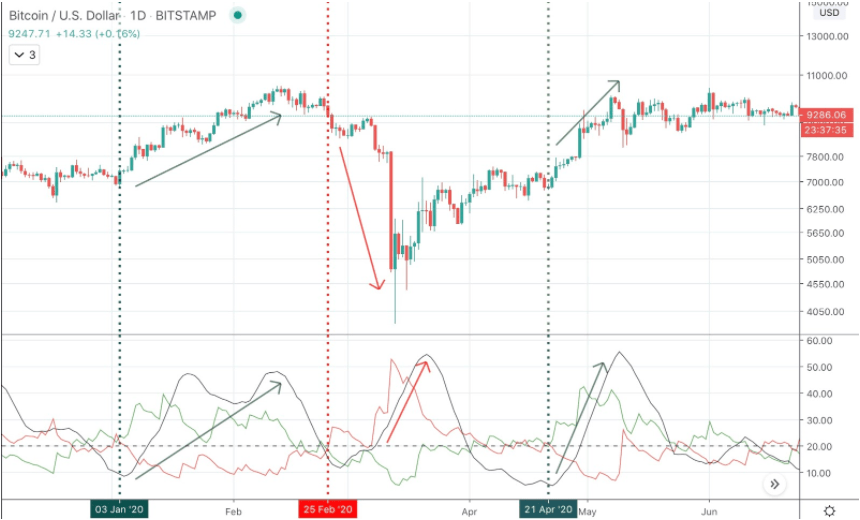
Average Directional Index
The Average Directional Index is one of many indicators created by J. Welles Wilder, who also created the Relative Strength Index and Parabolic SAR.
The Average Directional Index indicator is a technical analysis tool designed to offer a read on the strength of a trend. The indicator can also be used to signal when trends are weakening, potentially signaling a reversal is near.
Trends are considered strong at readings over 20, and weak under the key level. The higher the reading, the stronger the trend, but also the more likely the trend is topping out.
The ADX also comes with the DMI built in, which includes two directional movement indicators. The two indicators crossing can signal if the trend is bearish or bullish, then the ADX gauges the strength of that trend.


