Reason to trust
How Our News is Made
Strict editorial policy that focuses on accuracy, relevance, and impartiality
Ad discliamer
Morbi pretium leo et nisl aliquam mollis. Quisque arcu lorem, ultricies quis pellentesque nec, ullamcorper eu odio.
Support and resistance can be drawn with trend lines just like normal trends. However, because support and resistance can exist across a wide range of price action, depending on how strong each level of support or resistance is, there are better ways to achieve this using charting software.
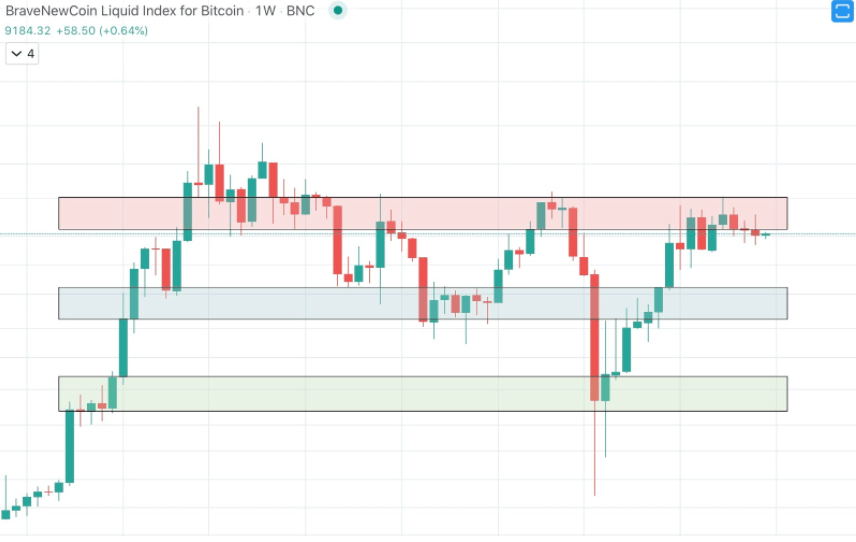
Another method is to utilize the rectangle tool. By drawing a rectangle across clusters of candle bodies closely clustered together, support and resistance levels can be drawn more clearly.
Using the rectangle tool, support and resistance across larger areas can be drawn more clearly. This is particularly helpful with staying cautious in case of a wick into support or resistance that quickly gets bought up or sold down.
It could appear a breakout through a trend line is taking place, but using the rectangle tool, traders can watch for price to fully clear resistance before taking action.