Reason to trust

How Our News is Made
Strict editorial policy that focuses on accuracy, relevance, and impartiality
Ad discliamer
Morbi pretium leo et nisl aliquam mollis. Quisque arcu lorem, ultricies quis pellentesque nec, ullamcorper eu odio.

Horizontal
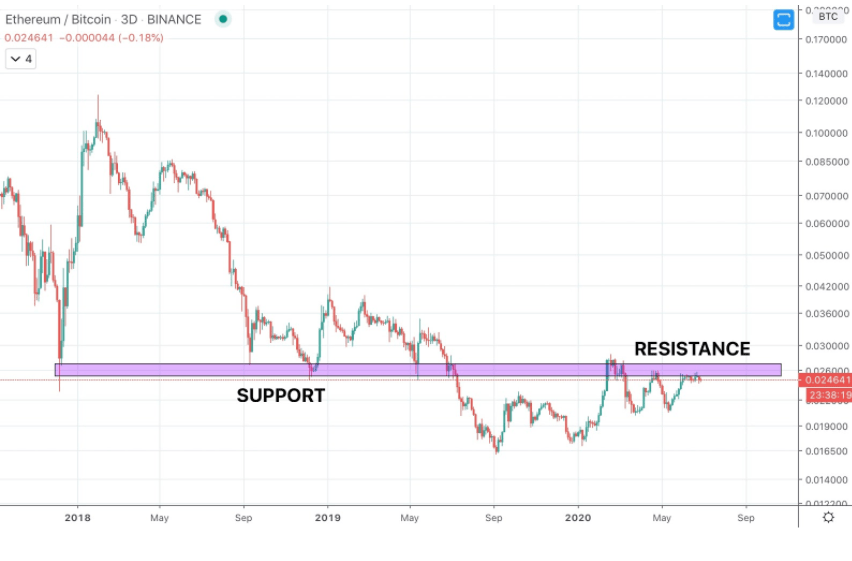
The most common type of support and resistance is horizontal.
Price moves up or down. Any areas where significant price action took place on the way up or down, can act as support or resistance.
This is also a level where an abundance of orders are located, and this is the reason why these areas can have such a strong reaction when price reaches it.
With so many orders in one area, when price approaches, orders rapidly triggering in succession can cause a rejection or reversal. The opposite is also true. If the price move is so strong it breaks through support or resistance, all of the orders it triggered could be stopped out, further amplifying the strength of the move through cascading effect.

Diagonal
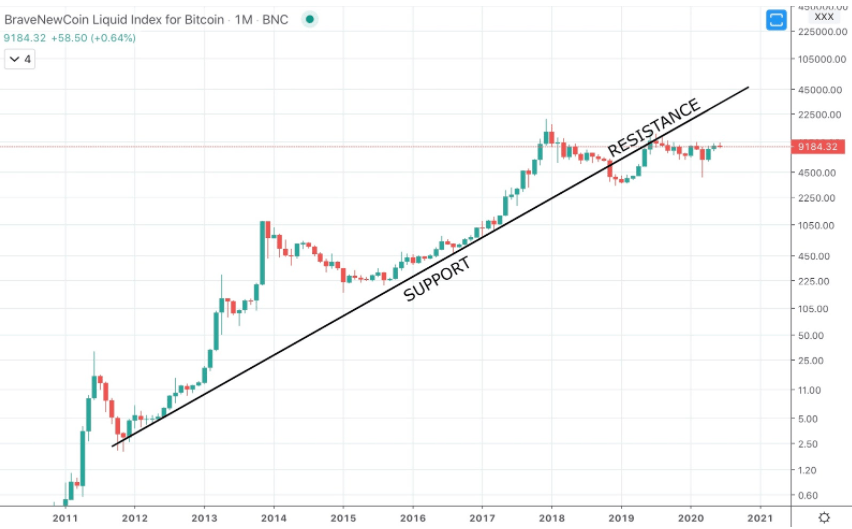
Trend line support from price patterns or up or downtrends can also act as powerful support or resistance.

Psychological
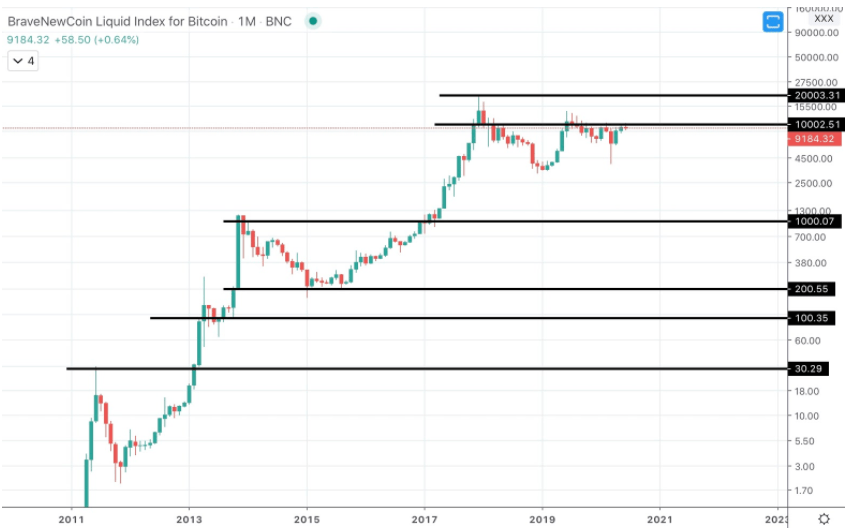
Bitcoin price never traded above $20,000, so the reason for a rejection there wasn’t due to other reasons for support and resistance to exist.
Instead Bitcoin topped out just ahead of $20,000. Why? Because traders anticipating a push to $20,000 front ran the psychological level by a few hundred dollars to make sure their orders filled.
$10,000 is yet another psychological barrier for Bitcoin price. Many rounded numbers act as such, both due to them being logical places to place an order, but also because rounded numbers are easier to input and remember.
Other repeating numbers in a sequence, such as $6,666 can act similarly as support or resistance, just due to the ease of entering the number into an exchange and placing a buy or sell order.

Mathematical
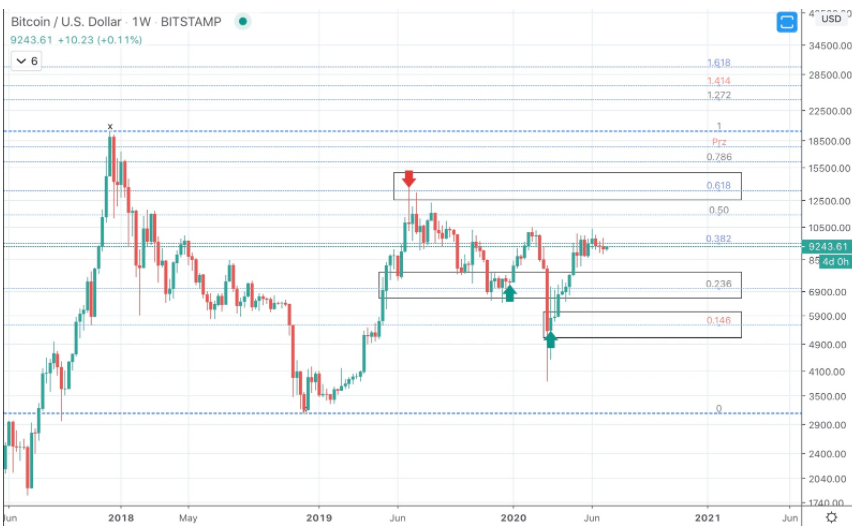
Certain Fibonacci retracement levels can also act as a support or resistance level. It’s not entirely understood why this is, however, it comes down to math and human emotion. Fibonacci numbers are everywhere, in nature, used in math, and in trading.
When Fibonacci numbers are multiplied by an asset’s price, it can provide potential support and resistance levels that the asset may retrace to.


