The peaks and troughs of all price action across all time frames often result in the formation of price patterns.
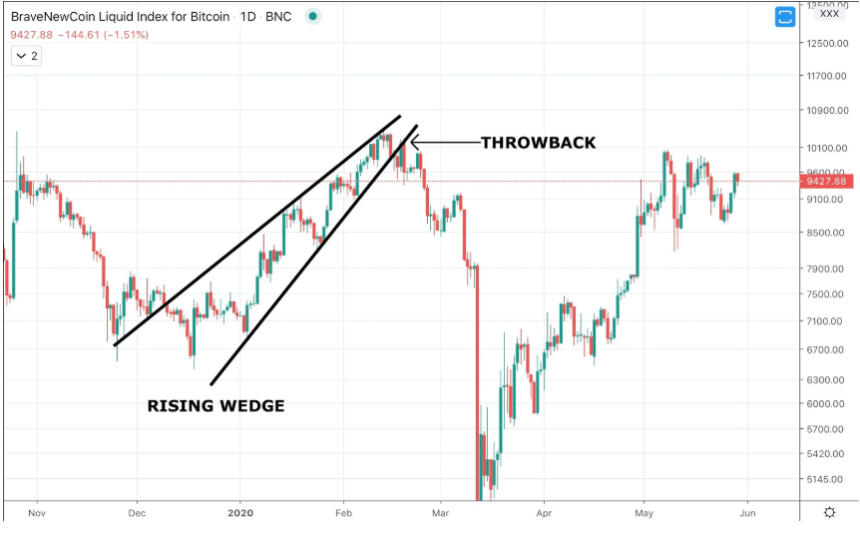
Common price patterns include flags, pennants, triangles, wedges, and more. These patterns can signal bullish or bearish results, depending on the type of pattern and the angle of the trend lines.
These chart patterns can also be used to assist traders in what positions to take, and what key price levels to watch.
Disclaimer: The article is provided for educational purposes only. It does not represent the opinions of NewsBTC on whether to buy, sell or hold any investments and naturally investing carries risks. You are advised to conduct your own research before making any investment decisions. Use information provided on this website entirely at your own risk.