Reason to trust
How Our News is Made
Strict editorial policy that focuses on accuracy, relevance, and impartiality
Ad discliamer
Morbi pretium leo et nisl aliquam mollis. Quisque arcu lorem, ultricies quis pellentesque nec, ullamcorper eu odio.
Bollinger Bands are yet another popular technical analysis indicator. The tool is named after its creator, financial analyst John Bollinger.
Bollinger Bands consist of a 20-day simple moving average and two standard deviations of the SMA. The two deviations act as graphic “bands” based on volatility. The band widens or tightens based on how volatile an asset is.
The wider the bands, the stronger the volatility in the corresponding price action. When the bands tighten, volatility has fallen. When the bands begin to “squeeze” or tighten to extremes, a coiling effect releases built-up momentum with a powerful breakout.
The midline or SMA can also be used as a signal to buy or sell when price action passes through it.
As much as 90% of price action takes place within the bands, so any breakouts and candle closes outside of the bands often results in a reversal.
Riding the bands is a strategy some traders utilize, however, a massive breakout in volume must also occur simultaneously, or the strategy is highly risky.
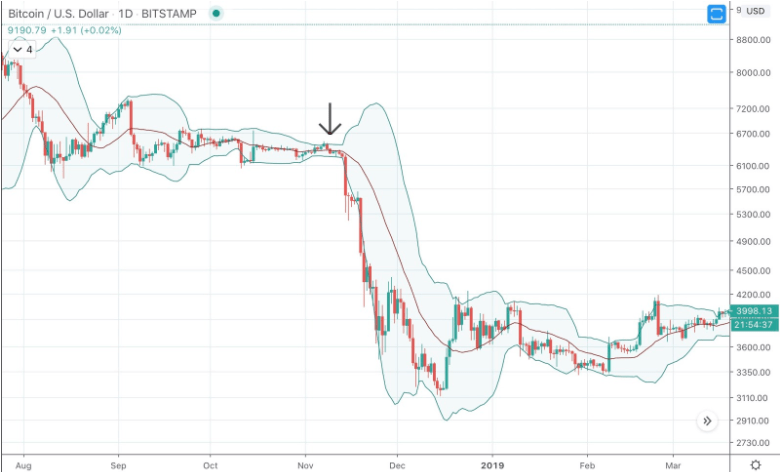
The below example shows the after effect of a tight squeeze of the Bollinger Bands.


