
Reason to trust
How Our News is Made
Strict editorial policy that focuses on accuracy, relevance, and impartiality
Ad discliamer
Morbi pretium leo et nisl aliquam mollis. Quisque arcu lorem, ultricies quis pellentesque nec, ullamcorper eu odio.
Stellar (XLM) started a strong increase above the $0.100 resistance against the US Dollar. XLM price is trading nicely above $0.110 and it could continue to rise towards $0.120 or $0.1250.
- There was a steady increase in Stellar’s token price above $0.100 against the US dollar.
- It is now trading above $0.1080 resistance and settle above the 100 simple moving average (4-hours).
- There is a major bullish trend line forming with support near $0.098 on the 4-hours chart of the XLM/USD pair (data source from Kraken).
- The pair is likely to continue higher towards $0.1200 and $0.1250 as long as it is above $0.0980.
Stellar (XLM) is Gaining Bullish Momentum
After forming a strong support base above $0.0750, stellar (XLM) saw a strong increase above $0.080 against the US Dollar, similar to Bitcoin and Ethereum.
The price gained over 20% in a few days and was able to clear the $0.10 resistance zone. It even cleared the $0.110 level. A high is formed near $0.1108 and the price is now consolidating gains. XLM price is now trading above $0.1080 resistance and settle above the 100 simple moving average (4-hours).
It is positioned above the 23.6% Fib retracement level of the recent increase from the $0.0998 low to $0.1108 high. There is also a major bullish trend line forming with support near $0.098 on the 4-hours chart of the XLM/USD pair.
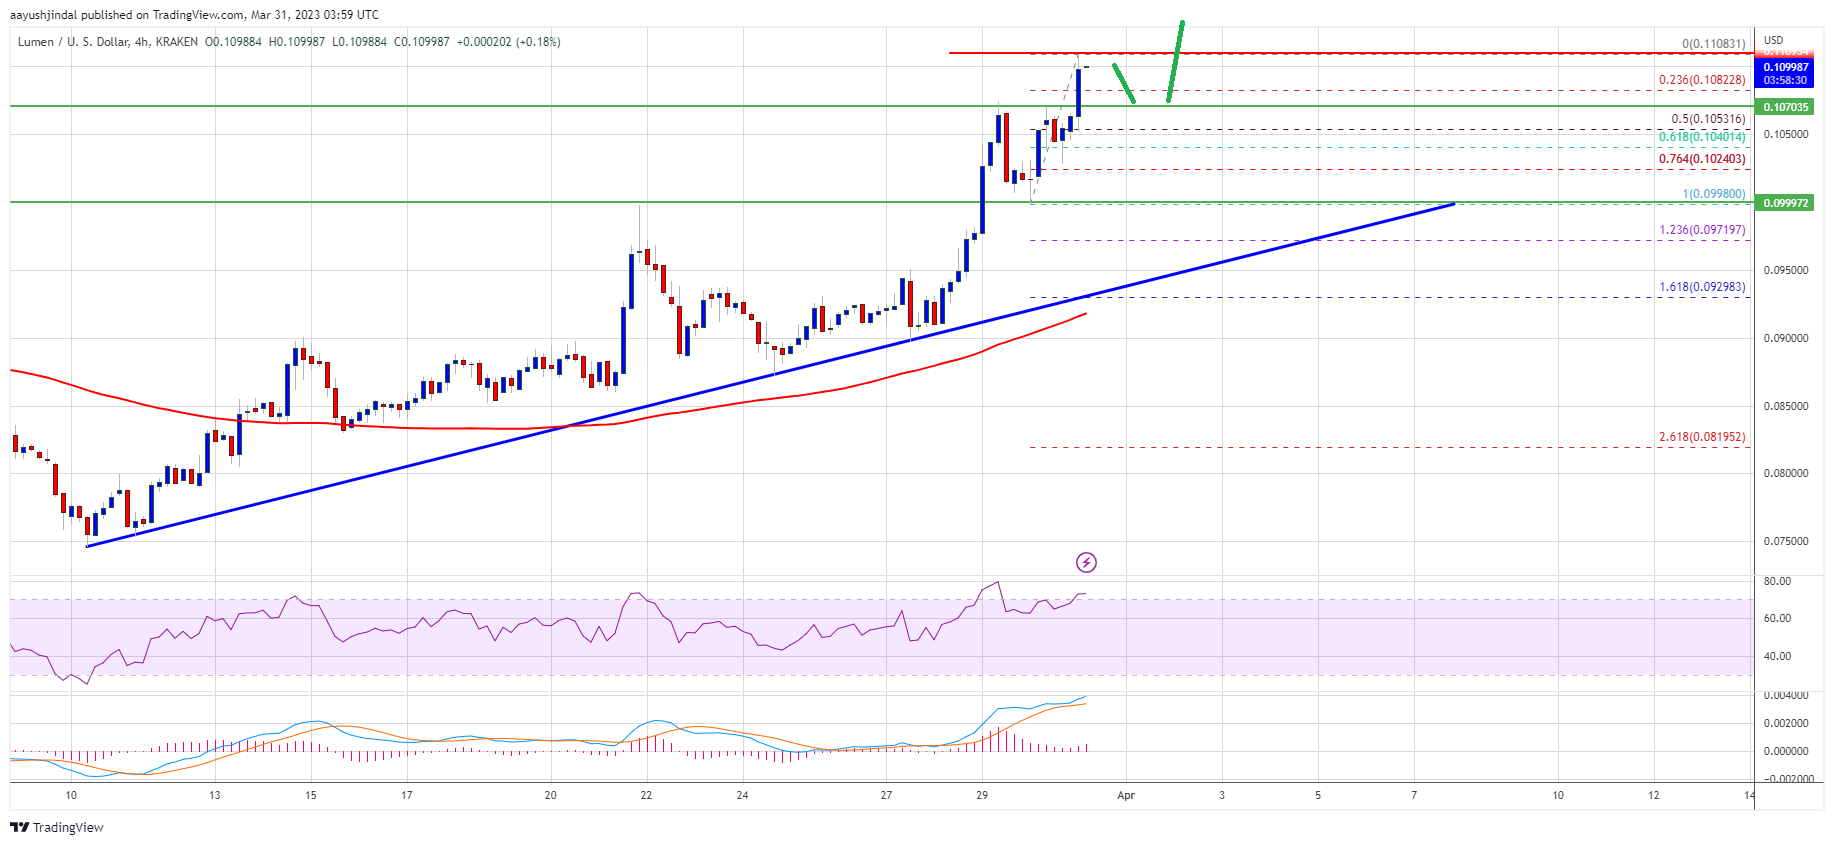
Source: XLMUSD on TradingView.com
On the upside, an immediate resistance is near the $0.1108 level. The next major resistance is near the $0.1150 level, above which the price could test $0.1200. A close above the $0.1200 level might start a steady increase towards the $0.1250 and $0.1265 levels. The next major stop could be $0.1300 or even $0.1320.
Dips Supported in XLM?
If XLM price struggles to continue higher, it could start a downside correction. An immediate support on the downside is near the $0.105 level or the 50% Fib retracement level of the recent increase from the $0.0998 low to $0.1108 high.
The next major support is near the $0.100 level or the trend line. A clear break below the $0.0980 support zone could spark a fresh decline. The next major support on the downside is near the $0.0900 level.
Technical Indicators
4-hours MACD – The MACD for XLM/USD is gaining pace in the bullish zone.
4-hours RSI (Relative Strength Index) – The RSI for XLM/USD is currently well above the 50 level.
Major Support Levels – $0.1050, $0.1000 and $0.0980.
Major Resistance Levels – $0.1108, $0.1200 and $0.1250.