Since technical indicators show a worrying picture of the price of the altcoin, crypto investors are closely monitoring Ripple (XRP). XRP has entered what many analysts consider as a bearish zone after closing below its 20-day exponential moving average (EMA) for four straight days.
Using the average price of XRP over the past 20 days as a resistance level, this technical indicator points to a possible change in market mood. Given the present price trading below this important benchmark, economists worry a drop in demand could be just ahead.
XRP was trading at $0.52 at the time of writing, down 0.3% and 3.1% respectively, data from Coangecko indicates shows for the last 24 hours and seven days.
Demand For XRP Loses Steam
XRP’s momentum indicators provide insights on the strength and direction of price fluctuations, therefore fuelling the bearish fire. Currently positioned below their neutral points are both the Relative Strength Index (RSI) and the Money Flow Index (MFI). This implies that investors might be aiming to sell existing XRP holdings instead of building more, therefore reducing the buying demand behind the coin.

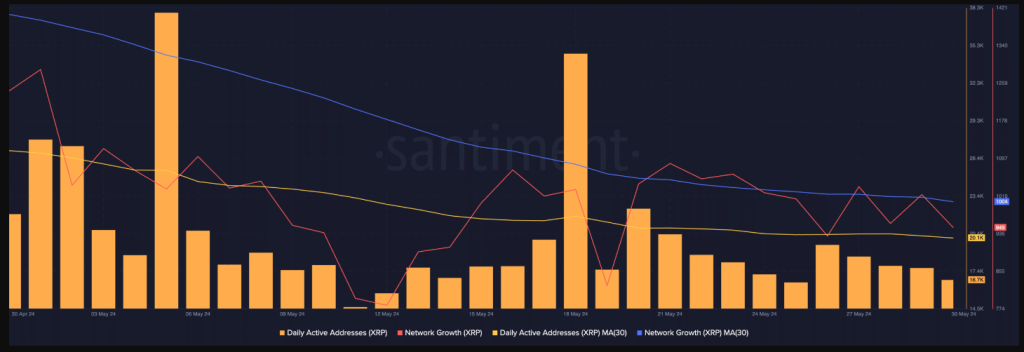
A notable decline in XRP’s active on-chain addresses further sows gloom. Data from Santiment indicates that over the past month daily active addresses on the XRP network have dropped by thirty percent. Since this drop in general network activity and user involvement suggests a pricing fall is likely to follow.
Profit Amidst The Gloom?
For XRP bulls, there remains some faint hope though. Fascinating statistics show that daily traders are still able to make profit. Daily transaction volume in profit compared to loss analysis of XRP reveals that 1.16 transactions produce gains for every transaction ending in a loss. This implies that, in spite of the general negative attitude, short-term trading prospects could remain for qualified investors able to profit on market volatility.
MVRV Ratio Offers A Different Perspective
The negative Market Value to Realised Value (MVRV) ratio for XRP could also appeal some investors. This statistic basically contrasts the average price at which all XRP tokens were bought with the present market price of XRP.
A negative MVRV ratio indicates that XRP is undervalued right now, hence investors looking for assets selling below their historical price points might find a buying chance.
XRP Price Forecast
Technical indicators point to a pessimistic market, although the present XRP price projection shows a 20% increase to $0.626627 by July 1, 2024. At 72 the Fear & Greed Index reflects high investor greed, implying significant purchasing activity but also a risk of overbought conditions and possible market falls should sentiment change.
