What if there is a way one can predict the next recession accurately? Except, there is none. But thousands of market experts, including economists, fund managers, and traders, still rely on something that help them measure the possibility of an economic crisis ahead. That something is called the US Yield Curve.
What is US Yield Curve?
US Yields represent a set of government bonds of different maturities issued by the United States government. A Yield Curve merely plots those bond yields on a graph with the Federal Reserve’s latest interest rate at one end and the 30-year Long Treasury bond at the other.
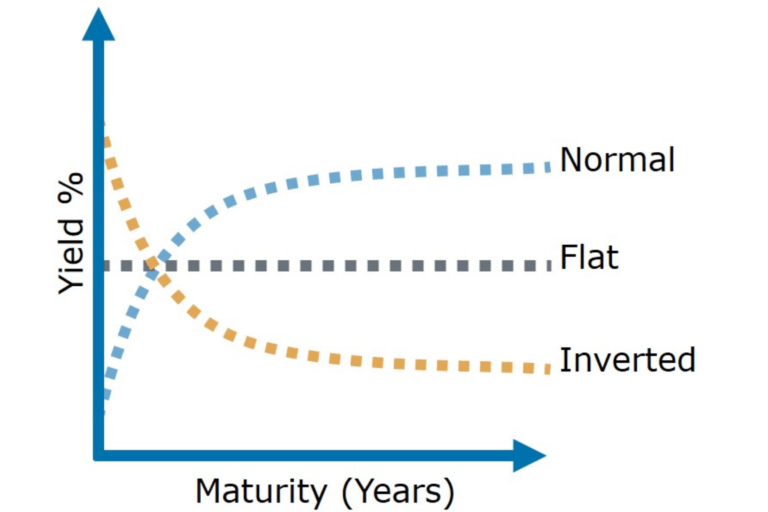
The ‘curve’ itself is ideally an upward slope drawn from left to right. On the lower end of the Slope are shorter-term Treasury Bonds, signifying that their yields are low. On the higher end of it are long-term Treasury Bonds, which have higher yields because they compensate investors for facing risks, such as inflation, for a longer timeframe. That means the so-called ‘normal curve’ would tend to rise upwards concerning the yields’ maturity.

The difference in yields against a near or long-term maturing bond reflects an investor’s view of the US economy. A Normal Curve shows signs of a healthy financial market since investors are willing to trust their Bond for a longer time frame.
But the bells of change ring when those curves go flat. That means the difference in a short- and long-term yields are declining, and investors now expect sluggish inflation and further economic growth – it is happening right now. It is further supported by the Fed’s decision to raise the interest rate last year, which increased short-term yields and, in the process, prompted the premiums on the long-term yields to decline.
That’s a sign of an inverted slope which, from a bond investor’s point of view, is a sign of a slowdown. It means the Fed will cut interest rates (they did) and inflation will drop (it is happening).
This week, the slope inverted for the first time since 2007.
US Recession Alert and Bitcoin Evangelism
A benchmark indicator presented by the difference in 2-year and 10-year Treasury yield now stands inverted. Earlier, the spread between the two maturities had gone above 290 basis points owing to the Fed’s expansionary policies post-2008 crisis. Now flipped, the yield signals the possibility of a recession in the US. It has been able to predict many economic slowdowns since the second world war, barring one time in the 1960s. So its likelihood of being correct is higher.
That is giving bitcoin evangelists plenty of opportunities to present the cryptocurrency as a messiah asset. Gabor Gurbacs, the director of digital assets strategy at VanEck, called bitcoin a “Plan B” against the negative-yielding government bonds.
According to Deutsche Bank, 27% of bonds in the world trade at a negative interest rate with a total market value of ~$15 trillion or 75x #bitcoin’s market cap. It’s time for Plan ₿! pic.twitter.com/KrZbR4ocxl
— Gabor Gurbacs (@gaborgurbacs) August 14, 2019
A non-sovereign asset, bitcoin has a fixed-supply structure which would exhaust upon the issuance of a total of 21 million units. It allows individual investors to treat the cryptocurrency as “digital gold” – and a competition to the real gold, as well – since it is easily transferrable and carriable than the yellow metal.
No concrete evidence proves mainstream investors are hedging into bitcoin while fearing recession. But Anthony Pompliano, who heads Morgan Creek Digital Assets, is hopeful that they would.
“Bitcoin’s price could fall 50% from today’s price of $10,600 and the digital currency would still be outperforming the S&P 500 in 2019,” he said on Wednesday.
Uh oh.
The spread on the 2 year / 10 year US bonds just inverted for the first time since 2007.
Really hope we aren’t headed towards a recession, but every day that is looking more likely…
— Pomp 🌪 (@APompliano) August 14, 2019


