Reason to trust

How Our News is Made
Strict editorial policy that focuses on accuracy, relevance, and impartiality
Ad discliamer
Morbi pretium leo et nisl aliquam mollis. Quisque arcu lorem, ultricies quis pellentesque nec, ullamcorper eu odio.
It is safe to assume that Bitcoin’s parabolic rally in 2020 has everything to do with the underperformance of its arch-nemesis, the US dollar.
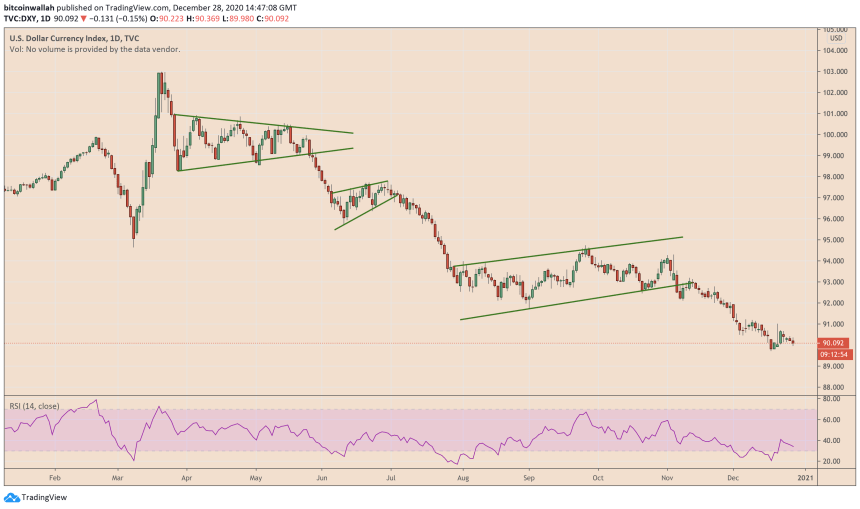
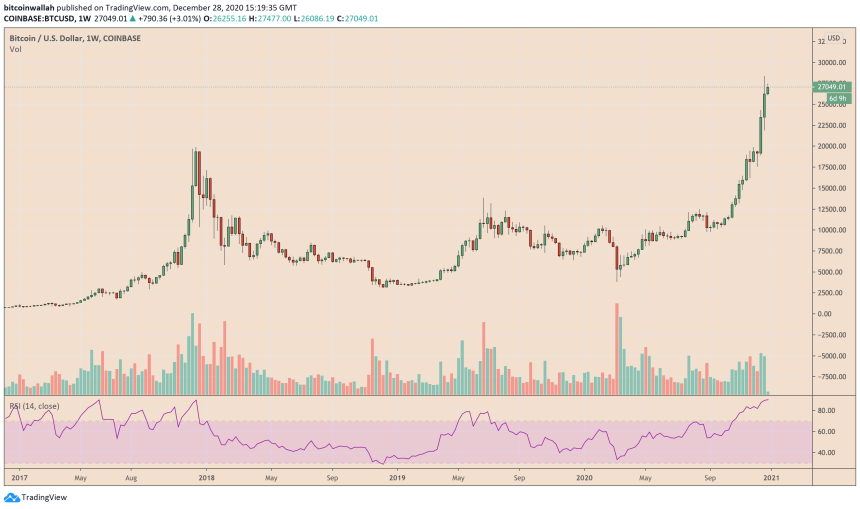
The charts tell the entire story. In March 2020, a 60 percent crash in the Bitcoin market coincided with an 8.80 percent jump in the US dollar index, a barometer to measure the greenback’s strength against a set of foreign currencies.
But later, Bitcoin regained its bullish momentum as its price notched higher by more than 600 percent. Meanwhile, the US dollar fell by up to 12.87 percent from its mid-March high.
US dollar is at the beginning of a cyclical bear market. Source: DXY on TradingView.com
The prolonged US dollar bearish momentum began after the Federal Reserve launched an open-ended bond-buying program and slashed its benchmark lending rates to almost zero. Later, the US government launched a $2.3 trillion stimulus program to help millions of Americans through the COVID-19 pandemic-led economic slowdown.
For investors, the scenario was crisp and clear. An abundant supply of the US dollar into the economy removed its purchasing power altogether. Fearing that their cash-based portfolio would suffer, they started increasing their exposure to riskier assets. Bitcoin, which comes with a limited supply cap of 21 million and a predefined supply rate, benefited from the said fundamentals.
Bitcoin is trading near its record high. Source: BTCUSD on TradingView.com
Entering 2021, the US economy is still facing the same set of fundamentals. The country’s coronavirus infection rates have soared higher and have prompted governments to impose fresh lockdowns. Meanwhile, the jobless rate continues to stay higher. As a result, the White House has passed another stimulus package, this time of a dwarfed $900 billion.
Bitcoin, around the same time, has reached a new record high above $28,300.
The Cyclical Scenario
Analyst at crypto-focused investment advisory firm TradingShot noted that the US dollar would continue its decline until 2025.
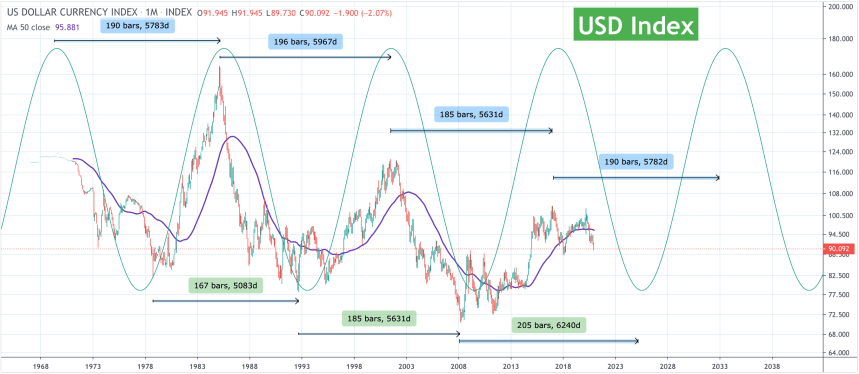
His bearish analogy borrowed cues from the greenback’s cyclical trends. Since the early 1970s, the US dollar index has witnessed three repetitive trends. Each cycle lasts for almost 5,700 days and prints about 190 monthly candles. Meanwhile, almost all of them have roughly the same cyclical bottom at near 78.
US Dollar index cycles. Source: DXY on TradingView.com
“As a result, while the next top for the DXY (which I have to add at this point that the sequence is Lower Highs) maybe around 2032/33, the next Bottom (based on the waves) should be around 2025,” the TradingShot analyst explained.
“That means that we are still a long way from seeing the cyclical bottom and the best course of action is to sell every rally,” he added.
Bitcoin Rally Until 2025?
Ronnie Moas, the founder of Standpoint Research — an investment management firm, noted that Bitcoin is on its way to hit $100,000 by 2022 should more institutions started using it as a hedge against their fears of dollar devaluation.
The macro analyst, who correctly predicted a $28,000 Bitcoin price target in late October, stated that the cryptocurrency would mousetrap a good portion of gold’s market capitalization in the future. Investors also treat the precious metal as a hedge against inflation, which makes it a direct rival to Bitcoin.
https://twitter.com/RonnieMoas/status/1342876545740894210
All and all, a 20 points drop in the US dollar index would push more firms and investors towards gold and bitcoin as safe-haven alternatives. By 2025, the cryptocurrency should be trading above $100,000, as per Mr. Moas’s prediction.


