Reason to trust

How Our News is Made
Strict editorial policy that focuses on accuracy, relevance, and impartiality
Ad discliamer
Morbi pretium leo et nisl aliquam mollis. Quisque arcu lorem, ultricies quis pellentesque nec, ullamcorper eu odio.
TRON has been on an uptrend and looking bullish for the past 12 hours. The technical indicators all imply an increased demand on the asset and a steady streak.
Here’s a quick glance of how the crypto has been performing of late:
- TRX price up by 0.20% as of this writing
- Technical indicators show increased TRX demand
- TRON second in line in terms of TVL
Tron Price Retraces By Half
According to CoinMarketCap, TRX price has spiked by 0.20% or is trading at .05529 as of this writing.
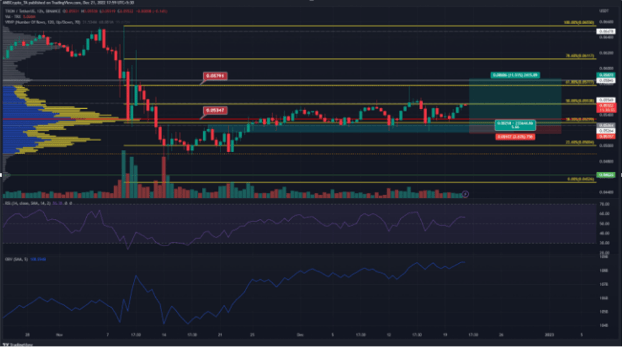
TRON has tested the key support level of $0.54 several times this month. TRX price has also retraced by 50% or currently at the $0.0578 level as the coin retreated from 0.066 to $0.047.

Source: TradingView
The Visible Range Volume Profile looked promising too as it showcased the point of control which is at the $0.055 level and with the value area high seen at $0.059.
On November 26, TRON retested the key support level of $0.0527. The bullish breaker can be spotted right below this level extending from $0.0527 to $0.0516.
Evidently, the price has tried to retest the bullish breaker several times, seeing a visible reaction on every retest performed.
TRON has recently disclosed they are second in line in terms of Total Value Locked (TVL), trailing behind Ethereum. It also demonstrated an impressive burn rate which only supports the premise of TRON’s accelerating growth.
TRX total market cap at $5 billion on the daily chart | Chart: TradingView.com
The frequent retests done on the bullish breakers as well as the higher lows has triggered the formation of a right-angled pattern which could be signaling a breakout northwards on price.
On the other hand, Bitcoin is trying to barrel past the mounting pressure experienced at the $17k-$17.4k, which hints that a pullback could give the bulls an opening to go and buy TRX.

Source: TradingView
Tron OBV On The Rise
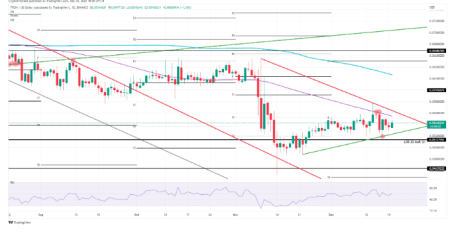
TRX is now being supported, but is failing to make any notable chart moves. Instead, price action is continuing to move sideways within the pennant that formed.
Meanwhile, a further rejection would send the TRX price action back down, where it would then attempt to test the support provided by the the ascending trendline.

Source: TradingView
Should that level be breached, bearish follow-through trading towards $0.051 can be anticipated.
Since November, it has been observed that TRON’s on-balance volume has been rapidly increasing, which demonstrates an exceptionally high level of buying pressure.
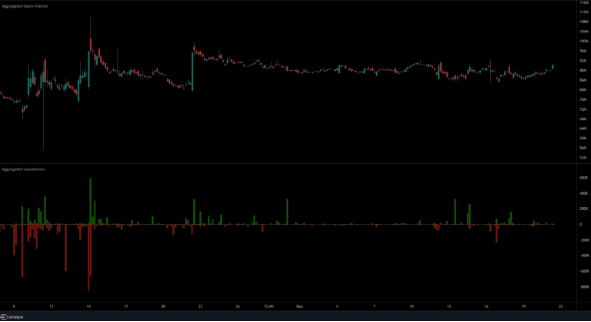
In this case, although the formation of the right-angled pattern hints at an upward breakout, there seems to be another scenario as shown in the flat open interest chart.
This suggests that TRX price may have already peaked which means a lack of further momentum could signify a weakening in the trend.


