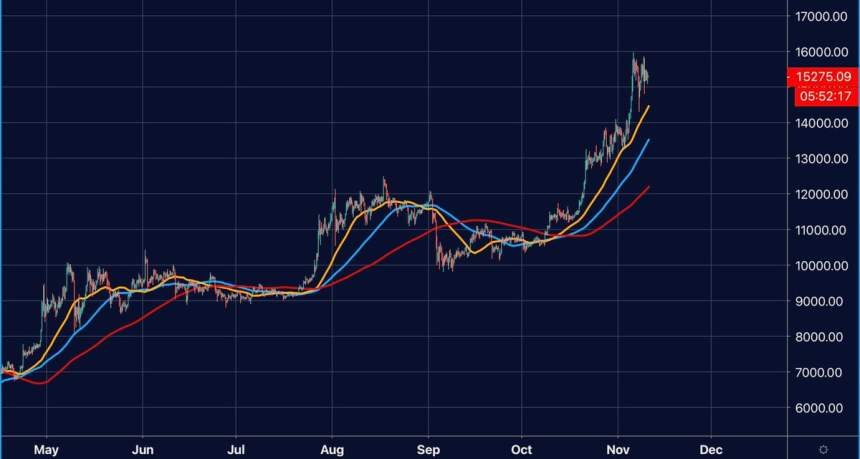
Bitcoin has seen some immense volatility throughout the past few days, rallying to highs of $15,800 just over a day ago before facing a sudden influx of selling pressure that sent its price plunging to lows of $14,800.
This $1,000 movement wiped out over-leveraged positions from both bulls and bears and has resulted in the cryptocurrency consolidating squarely between these two levels.
It remains somewhat unclear as to where it may trend in the near-term, as any continued bout of weakness could confirm $16,000 as a long-term top followed by further downside.
However, the aggressive buying pressure seen on each dip seems to indicate that the benchmark cryptocurrency is being driven by immense underlying strength.
Where it trends in the mid-term should depend largely on its continued reaction to the selling pressure that exists around $16,000.
One trader is now noting that one set of technical indicators suggests that Bitcoin could be on the cusp of entering a prolonged consolidation phase.
He notes that the last time these indicators formed a pattern similar to that seen presently, BTC consolidated for months before drifting lower and eventually extending its upwards momentum.
Bitcoin Struggles to Stabilize Above $15,000 as Sellers Step Up
Following the rebound from $14,800 yesterday, Bitcoin has faced some intense selling pressure around $15,400, with each break above this level being quickly followed by sharp declines.
Where it trends in the near-term should depend largely on whether or not buyers can break above this level and move to test $16,000 once again.
If the cryptocurrency fails to break above this level and declines below $15,000, it could be a sign of underlying weakness and cause the crypto to see further losses in the days ahead.
Trader Claims Prolonged Consolidation Phase Likely
While sharing his thoughts on where the crypto might trend in the near-term, one analyst explained that he believes Bitcoin could be positioned to see a prolonged consolidation phase in the days and weeks ahead.
“BTC – notice the MA spread this time still at the extremes, the last two spreads at these levels eventually coiled and bear crossed taking months to do so, MA50 (brown) still yet to be tested as support Bitcoin 6hr chart, consolidation could take some time historically speaking.”

Image Courtesy of Big Chonis Trading. Source: BTCUSD on TradingView.
The coming week should provide some insight into this possibility and whether this marks the start of a prolonged Bitcoin consolidation phase.
Featured image from Unsplash.
Charts from TradingView.


