

Solana has broken through the critical $164 level, fueled by strong bullish momentum, pushing the price higher. With the bulls leading this charge, the question remains: how far can this rally go? As Solana shows no signs of slowing down, all eyes are on whether it can sustain this newfound strength and continue to climb to new heights.
With optimism building around SOL’s potential for continued growth, this article aims to analyze the recent price surge past the $164 level, focusing on the upbeat momentum propelling the rally. It will assess the likelihood of further gains, evaluate key support and resistance levels, and provide insights into whether the current trend is sustainable.
Technical Analysis: What SOL’s Chart Signals Reveal
Currently, on the 4-hour chart, SOL is sustaining its position after successfully surpassing the $164 mark while trading above the 100-day Simple Moving Average (SMA). By maintaining its position above this level and the 100-day SMA, SOL demonstrates resilience and potential for more upward momentum toward the resistance of $194.

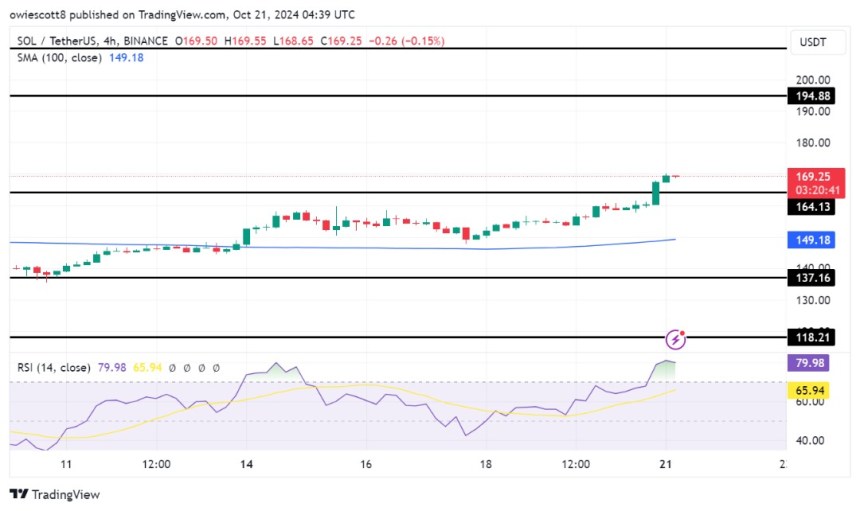
An analysis of the 4-hour Relative Strength Index (RSI) shows a significant surge, climbing to 81% from its previous low of 44%, indicating strong bullish pressure for Solana. While this increase signals growing positive market sentiment, it also raises concerns about the rally’s sustainability, as a possible price correction could occur if profit-taking ensues.
Furthermore, the daily chart indicates that SOL is trading above the 100-day SMA, a strong signal of upside movement. This push is marked by a rebound at $137, demonstrating significant buying interest. The fact that SOL is consistently above the 100-day SMA suggests a solid trend and that the bulls are eager to push prices higher if pressure continues to build.
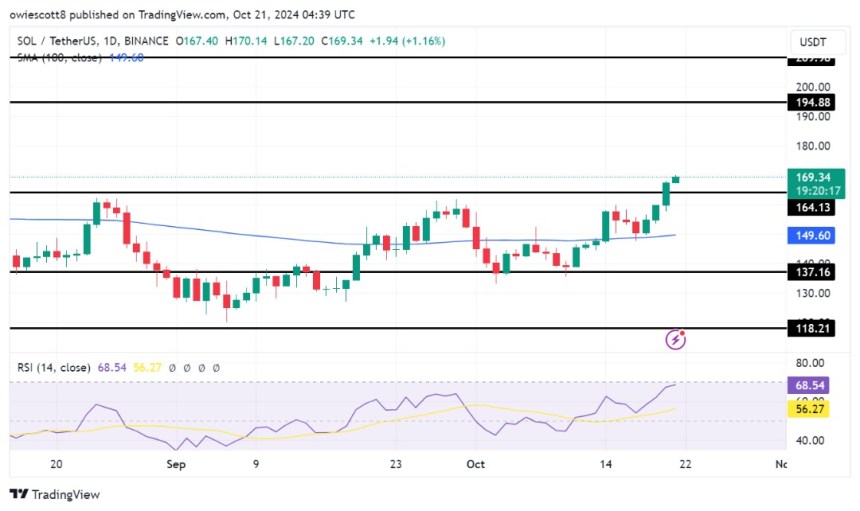
Lastly, the RSI on the daily chart is currently positioned at 68%, significantly above the pivotal 50% threshold, which indicates a bullish trend for Solana. At 68%, the RSI indicates that SOL’s upward pressure will likely persist, supporting the possibility of continued price gains in the near term as it has not yet reached the overbought territory.
Upside Potential: Could Solana Reach New Highs?
The recent surge past $164 has sparked speculation about Solana’s potential for new highs. If the upward momentum continues, it could open the door for further movement toward the $194 resistance level. A breakout above this level might set Solana on a path to challenge the resistance at $209 and possibly even higher.
However, it’s crucial to remain vigilant for possible pullbacks that could cause the price to drift downward toward the $164 support level. Additionally, a break below this level could pave the way for further declines, potentially targeting the $137 support level and other subsequent support zones.
