

Solana is showing renewed strength, signaling a potential turnaround after holding above $137 decisively. Buyers are stepping in at key support levels, pushing the price higher and challenging major resistance zones. This shift has sparked optimism that SOL can sustain its upward push and trigger a full recovery.
Despite recent struggles, Solana’s price action suggests that the bulls are not backing down. However, a true breakout will require clearing critical resistance levels that have previously capped gains. Solana could see a significant rally unfold if buyers maintain control and push past these barriers. On the other hand, failure to sustain the momentum may lead to another pullback, keeping bearish forces in play.
Solana Price Eyes Fresh Uptick
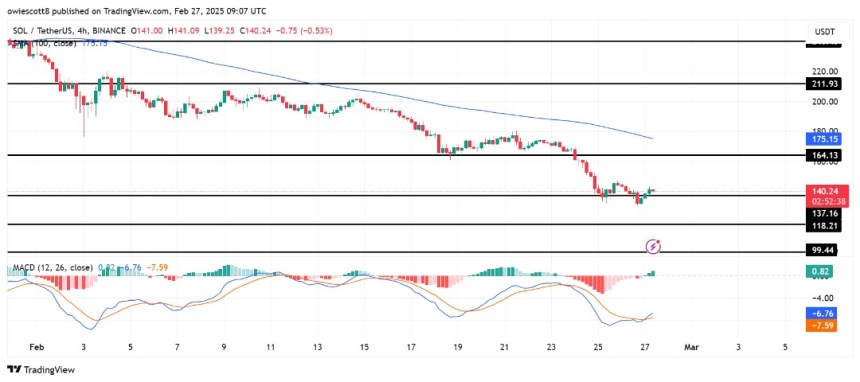
After failing to break below the $137 support level, SOL’s price has regained bullish momentum, eyeing a possible recovery. Buyers have stepped in to defend this key zone, driving the price upward as it targets the $164 resistance level. The renewed strength also brings the 100-day Simple Moving Average (SMA) into focus, a critical barrier that could determine whether SOL extends its rally or faces another rejection.
A successful breakout above both levels might confirm a stronger recovery, triggering a rally toward the $211 resistance zone. Such a move would indicate an uptrend, attracting more buyers and reinforcing confidence in Solana’s performance.

Breaking past this key resistance would signal a shift in short-term sentiment and a broader change in the cryptocurrency’s market structure. If sustained, this renewed strength will further solidify SOL’s bullish outlook and position it for continued upside in the coming sessions.
Also, the Moving Average Convergence Divergence (MACD) indicator is signaling a potential shift in momentum. The MACD line is approaching a crossover above the signal line, a classic indication of improving buying pressure. Additionally, the histogram shows a gradual increase in positive movements, suggesting that bullish forces are gaining traction.
Potential Bearish Outcome: Is The Recovery at Risk?
SOL’s bulls’ and the MACD’s failure to sustain its bullish crossover or start to weaken may lead to another period of consolidation or a pullback. Furthermore, a decline in trading volume alongside weakening indicators further confirms a slowdown, increasing the risk of another bearish turn.
Should this scenario unfold, SOL’s price eye another drop below the 137 mark, possibly extending the current bearish trend toward the $118 support area. While this could signal further downside, the $118 zone might also act as a key level of stability, creating an opportunity for buyers to step in and fuel a recovery.
