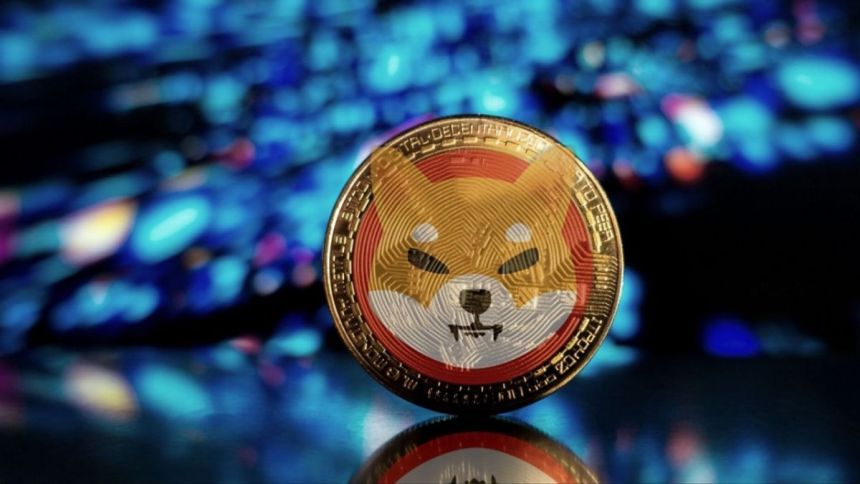
The second most popular meme coin on the crypto market, Shiba Inu (SHIB), is about to launch its eagerly awaited layer 2 scaling solution Shibarium.
While lead developer Shytoshi Kusama has repeatedly said in recent weeks that the launch date is not yet set but will be “soon,” he may now have leaked the beta launch date himself wrapped in a word puzzle. He revealed the decisive hint in his Twitter bio, where he writes:
Tending the Pine Tree of Life. Quickly learning to play the flute before putting Shibarium in a heart shaped box with a bow.
For the Shiba Inu community, this is an unmistakable clue that the beta version of Shibarium will be released on Valentine’s Day, February 14.
Already on January 15, Kusama had posted a prelude to his announcement, where he mysteriously stated:
During fall the tree may have only a few leaves, but then spring appears.
Luckily, Shibarium, in this context, is a Pine Tree. Still, it needs water, sunlight and proper soil. But pines survive and thrive during the harshest winters. (I also hear the needle tea is good for you.)
Shiba Inu (SHIB) Price Reacts By Moving Up 4%
Shiba Inu (SHIB) has risen almost 4% in the last 24 hours and 21% within the last week, with the price currently standing at $0.00001249. Trading volume was around $305 million within the last 24 hours, representing a -55% decrease against the previous time period.
Year-to-date (YTD), SHIB is up about 43% at the current price, the highest level since early November 2022.
This rally has been mainly driven by two reasons: on the one hand, macroeconomic sentiment has improved substantially, giving the overall crypto market a strong boost, and on the other hand, Shibarium has provided some level of FOMO.
However, a look at the 1-week chart of SHIB reveals that the price should still be assessed as mostly bearish. In its third attempt since September 2022, SHIB’s price has failed to close above $0.000014 on a weekly basis.
The resistance zone between $0.000013 and $0.000014 has so far proved too stubborn to confirm a breakout from the bearish territory.
The 1-day chart shows the massive drop from the lower end of the resistance zone at $0.000013 very clearly. Currently, however, SHIB is finding support from the 200-day exponential moving average (EMA).
As signaled by the daily RSI, Shiba Inu (SHIB) is in an overbought condition. On a daily basis, the RSI remained significantly in the overbought zone, 79 at press time.
Ideally, the RSI causes investors to reduce their positions and thus initiate a price correction on a price basis. Otherwise, there would have to be a correction on a time basis, which would mean a longer sideways trend below the resistance zone.
To trigger a sustained bullish breakout on the daily and weekly charts, Shiba Inu needs to break above the $0.000014 level within the next few weeks.
Featured image from VOI, Charts from TradingView.com
