Key Highlights
- Rubycoin price is making an attempt to recover after sliding in towards 0.000100BTC.
- Buyers are pushing the price higher and taking it towards a major bearish trend line and resistance area.
- The hourly RSI is in the negative zone, pointing that the price is still under a bearish pressure.
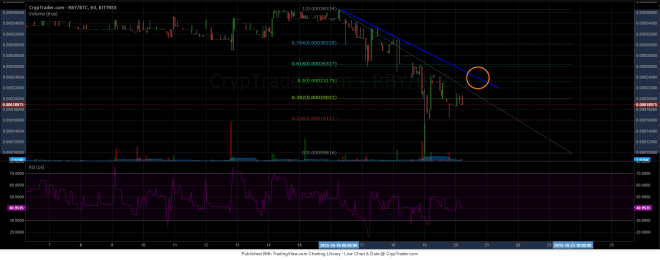
Rubycoin price is recovering, but it is closing in towards a major resistance area around 0.000230BTC.
0.000230BTC as a Resistance
As mentioned yesterday that the Rubycoin price tumbled recently and traded 0.000100BTC. However, buyers appeared around the stated level to prevent any additional downsides. The price is currently correcting higher and trading near the 38.2% Fib level of the last leg from 0.000365BTC to 0.000100BTC. There is also a bearish trend line formed on the hourly chart, which might act as a barrier if the price continues to move higher. The highlighted trend line also coincides with the 50% Fib retracement level.

If the price manages to clear the 38.2% Fib level, then the 50% Fib level along with the trend line area could be tested. Buyers might struggle to clear the highlighted trend line and resistance area. However, if they succeed, it may clear the way for more gains in the near term. The next area of interest in that situation could be around the 61.8% Fib level, followed by the last swing high of 0.000365BTC.
On the other hand, let’s say if the price moves lower, then an initial support might be around 0.000200BTC. If sellers manage to break the stated level, then a move towards the last low of 0.000100BTC is also possible in the short term.
Intraday Support Level – 0.000200BTC
Intraday Resistance Level – 0.000231BTC
The hourly RSI is below the 50 level, which is a signal that buyers are struggling to take the price higher.
Charts courtesy of Cryptrader


