Reason to trust
How Our News is Made
Strict editorial policy that focuses on accuracy, relevance, and impartiality
Ad discliamer
Morbi pretium leo et nisl aliquam mollis. Quisque arcu lorem, ultricies quis pellentesque nec, ullamcorper eu odio.
XRP price is eyeing a key upside break above the $0.650 resistance. The price could rally toward $0.70 if it clears the $0.650 resistance.
- XRP is slowly moving higher above the $0.612 level.
- The price is now trading above $0.615 and the 100 simple moving average (4 hours).
- There was a break above a major declining channel with resistance near $0.618 on the 4-hour chart of the XRP/USD pair (data source from Kraken).
- The pair start a fresh rally if it clears the $0.645 and $0.650 resistance levels.
XRP Price Aims Higher
In the past few days, XRP formed a base above the $0.5880 pivot level. The price started a decent increase above the $0.600 resistance but failed to rally like Bitcoin and Ethereum.
There was a move above the 23.6% Fib retracement level of the main decline from the $0.720 swing high to the $0.5720 swing low. Besides, there was a break above a major declining channel with resistance near $0.618 on the 4-hour chart of the XRP/USD pair.
The price is now trading above $0.615 and the 100 simple moving average (4 hours). On the upside, immediate resistance is near the $0.625 level. The first major resistance is near the $0.645 zone or the 50% Fib retracement level of the main decline from the $0.720 swing high to the $0.5720 swing low.
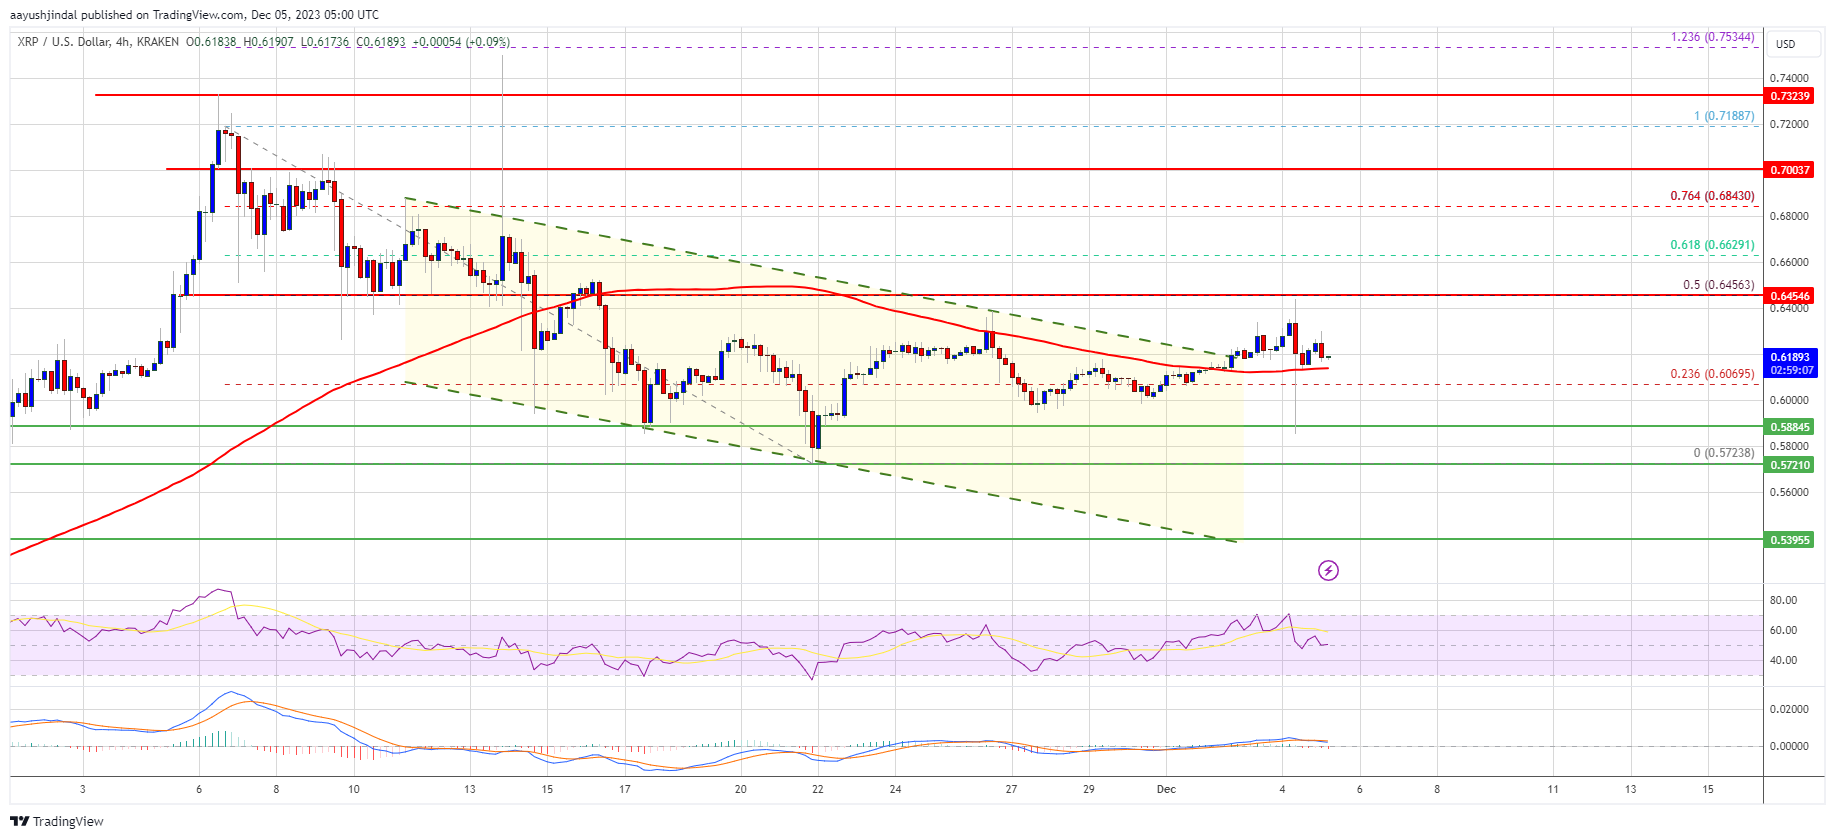
Source: XRPUSD on TradingView.com
The main resistance sits at $0.650. A close above the $0.650 resistance zone could spark a steady increase. The next key resistance is near $0.685. If the bulls remain in action above the $0.658 resistance level, there could be a rally toward the $0.700 resistance. Any more gains might send XRP toward the $0.720 resistance.
Another Decline?
If XRP fails to clear the $0.650 resistance zone, it could start a fresh decline. Initial support on the downside is near the $0.615 zone and the 100 simple moving average (4 hours).
The next major support is at $0.600. If there is a downside break and a close below the $0.600 level, XRP price might accelerate lower. In the stated case, the price could retest the $0.572 support zone.
Technical Indicators
4-Hours MACD – The MACD for XRP/USD is now gaining pace in the bearish zone.
4-Hours RSI (Relative Strength Index) – The RSI for XRP/USD is now near the 50 level.
Major Support Levels – $0.600, $0.588, and $0.572.
Major Resistance Levels – $0.645, $0.650, and $0.700.