The XRP price has risen by around 6% in the past three days, triggering renewed optimism among investors and analysts. The two analysts Dark Defender and Egrag see the current trend as a turning point.
XRP Price Correction Over?
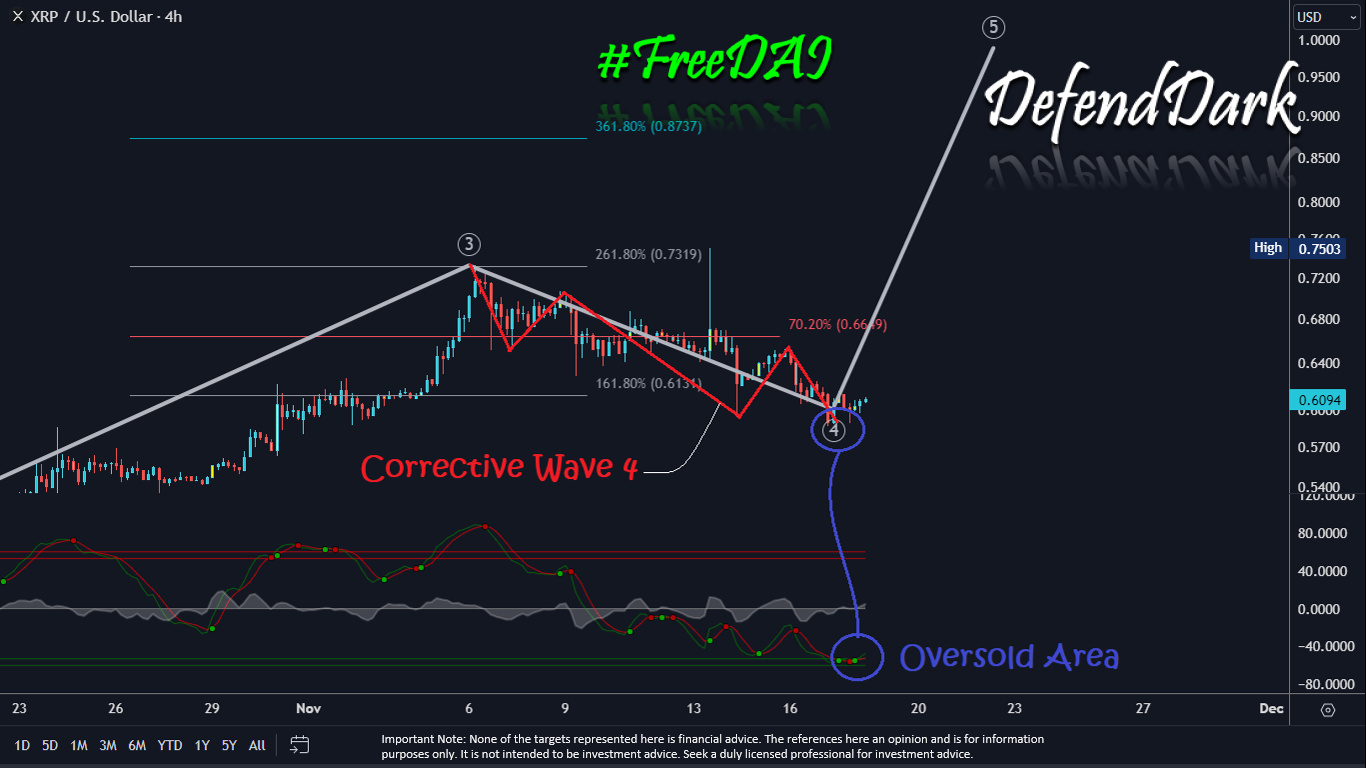
Dark Defender has highlighted a key development in the 4-hour time frame, observing the end of a corrective structure and identifying that XRP has reached an oversold area. “We can expect a move to $0.6649 first,” Dark Defender stated, referencing the Fibonacci retracement levels and a 5 Wave Elliott structure that remains intact, suggesting upward potential.
This is supported by the chart that shows XRP has managed to close above a critical level at $0.6131, which aligns with the Elliott Wave Theory’s rules for wave structures. The analyst further emphasized that the $0.87-$1.05 price target is still achievable in the near term if weekly closes maintain above the $0.6131 threshold.

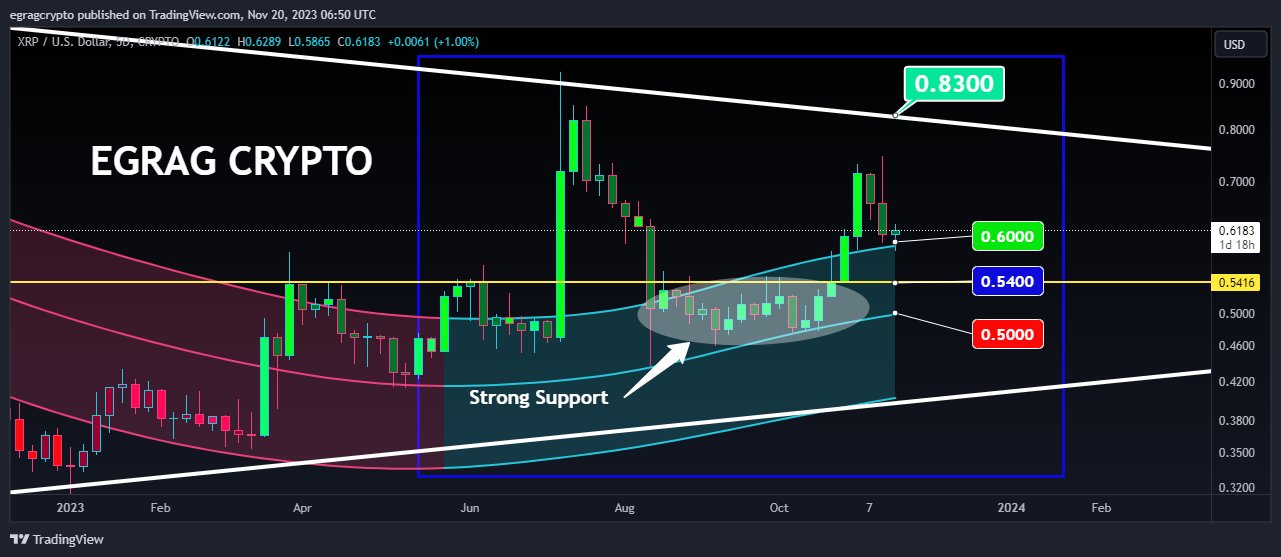
Egrag’s analysis focuses on the gaussian channel and a symmetrical triangle pattern (in the 5-day chart), which are indicative of consolidating markets leading to a potential breakout. According to Egrag, “XRP Gaussian Channel & Symmetrical Triangle Unveil (Strong Support and Resistance Patterns): Within the framework of the Gaussian Channel, the alignment of support and resistance price targets mirrors other charts, adding weight to their significance.”
The provided chart by Egrag points to a “robust support” at $0.50, with additional support levels at $0.54-$0.55 (“support range”) and $0.60 (“support threshold”). The resistance levels are identified by Egrag at a macro resistance point and a symmetrical triangle trend line between $0.83 and $0.85. Egrag advises the XRP community to remain steadfast, saying, “XRP Army STAY STEADY, anticipate the forthcoming mega pump, yet exercise caution by strategically allocating portions of your holdings.”

Combining these technical analyses, it’s clear that both analysts are pinpointing a convergence of technical indicators suggesting a bullish reversal for XRP. Dark Defender’s chart analysis, with its emphasis on Elliott Wave continuation, and Egrag’s identification of Gaussian Channel patterns, both point to a potential increase in the price, provided it remains above certain support levels.
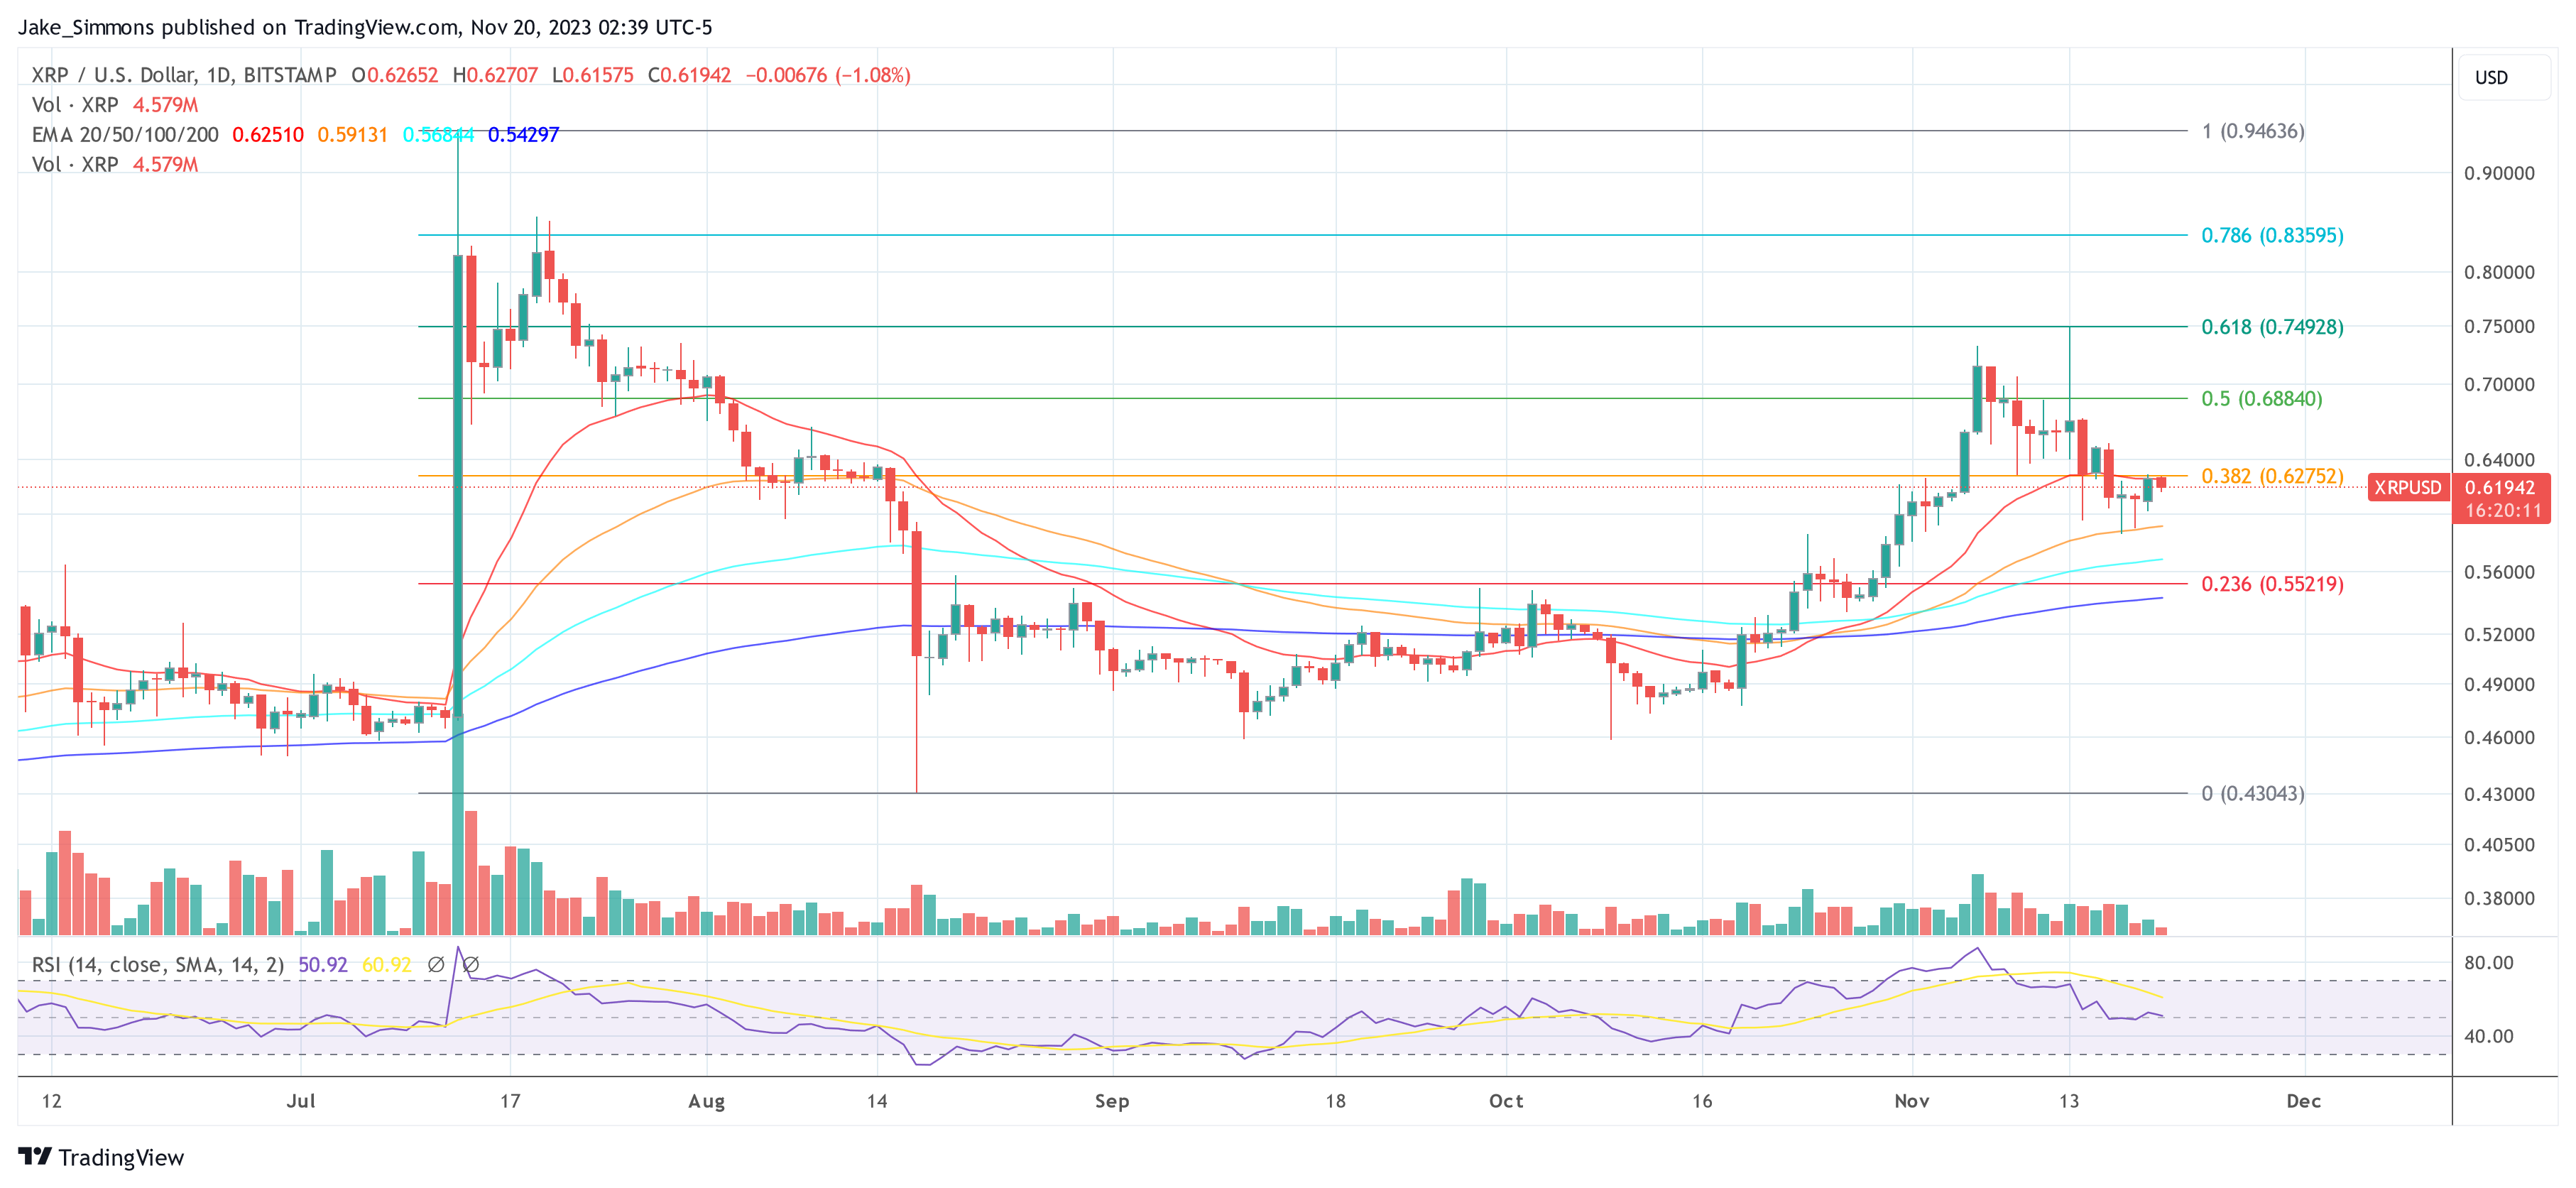
Price Analysis: 1-Day Chart
The analysis of the 1-day chart of XRP using the Fibonacci retracement level shows that the price is facing strong resistance in the short term.
At the current price of $0.6194, XRP is just below the 0.382 Fibonacci retracement level at $0.627 and below the 20-day Exponential Moving Average (EMA) at $0.625. The confluence of these two indicators represents significant resistance in the short term. Remarkably, XRP has received important support at the 50-day EMA at $0.591, which could allow the bulls to regain the upper hand.
For this to happen, however, resistance at $0.625 needs to be broken. The next price targets could then be the 0.5 Fibonacci retracement level at $0.688 and the 0.618 Fibonacci retracement level at $0.759, which abruptly halted the upward movement that began in early October and ushered in the current consolidation.