
Reason to trust
How Our News is Made
Strict editorial policy that focuses on accuracy, relevance, and impartiality
Ad discliamer
Morbi pretium leo et nisl aliquam mollis. Quisque arcu lorem, ultricies quis pellentesque nec, ullamcorper eu odio.
Ripple is rising steadily from the $0.1680 support area against the US Dollar. XRP price is likely to rally 3%-4%, similar to the recent move in bitcoin and Ethereum.
- Ripple price is slowly gaining bullish momentum above the $0.1720 level against the US dollar.
- The bulls are likely aiming an upside break above the $0.1780 and $0.1800 resistance levels.
- There is a key bearish trend line forming with resistance near $0.1760 on the hourly chart of the XRP/USD pair (data source from Kraken).
- The pair could dip a few points, but it remains well supported near the $0.1720 level.
Ripple Price Could Rally Soon
Recently, there was a strong upward move in bitcoin and Ethereum, but ripple failed to follow in a similar fashion. XRP price traded as low as $0.1680 and climbed back above the 100 hourly simple moving average.
There was a steady rise above the $0.1720 resistance level. The bulls were able to surpass the 50% Fib retracement level of the recent decline from the $0.1784 high to $0.1680 low.
However, the price is still well below the $0.1780 weekly resistance area. There is also a key bearish trend line forming with resistance near $0.1760 on the hourly chart of the XRP/USD pair.
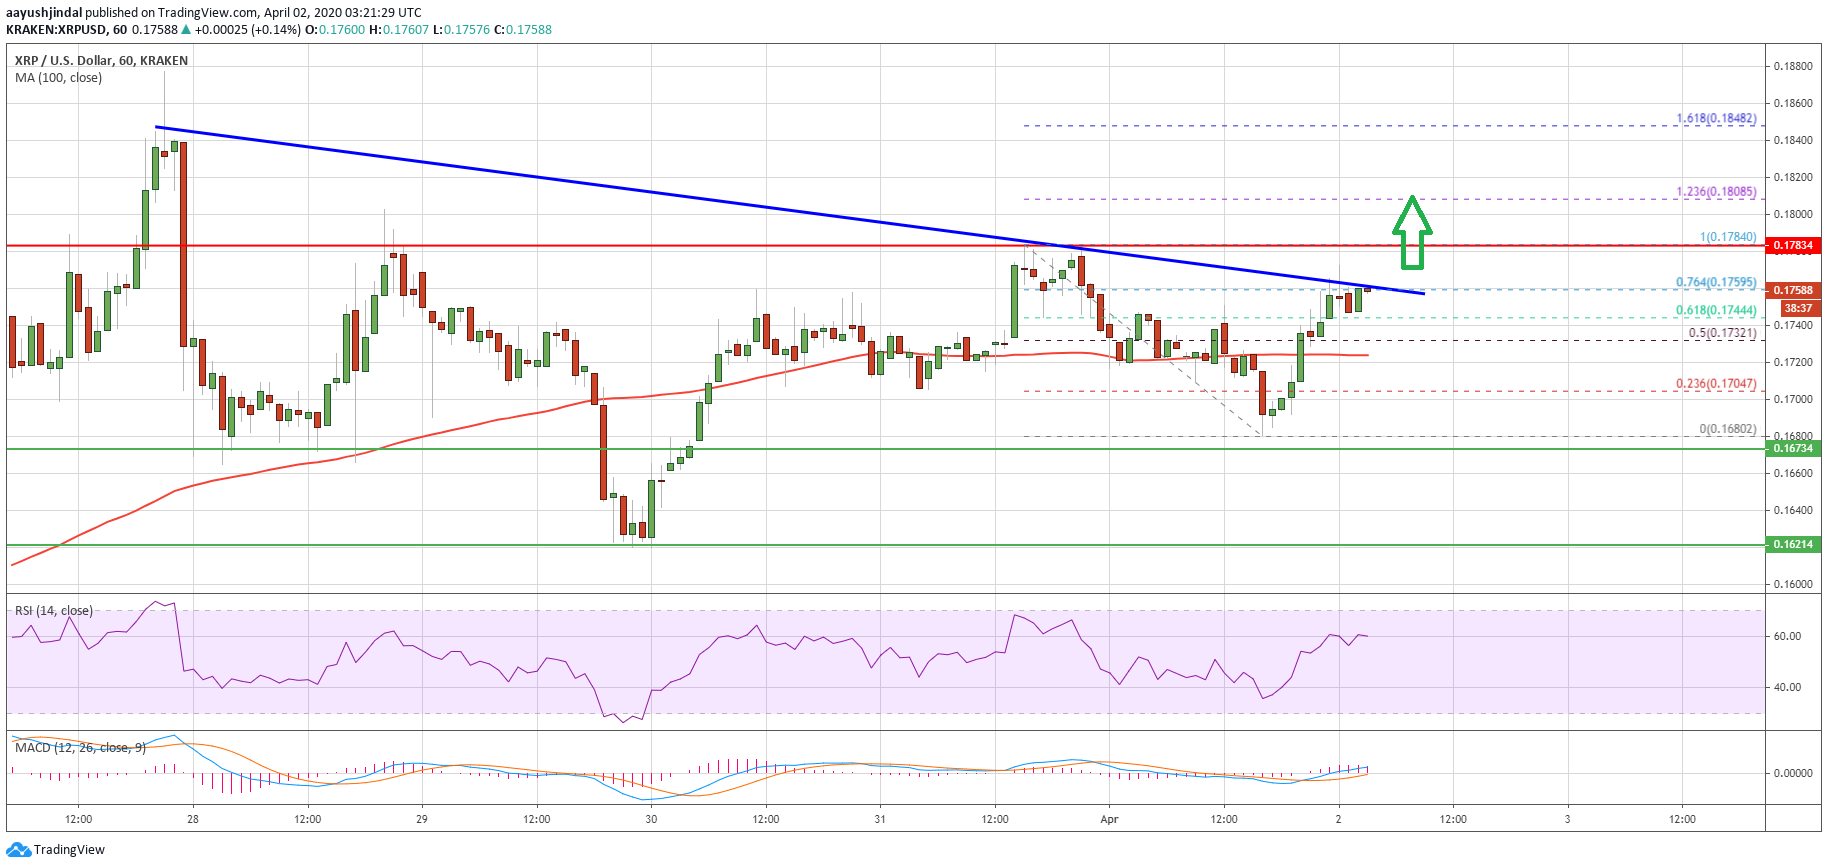
Ripple is currently testing the trend line resistance at $0.1760. The 76.4% Fib retracement level of the recent decline from the $0.1784 high to $0.1680 low is also acting as a hurdle.
If there is a clear break above the trend line resistance, the bulls are likely to make another attempt to clear the $0.1780 resistance area. If they succeed, XRP price is likely to surge above the $0.1880 and $0.1920 levels. The next major resistance is near the $0.2000 level.
Downside Correction?
If ripple fails again to climb above the $0.1780 resistance, it could correct lower. An initial support on the downside is near the $0.1720 level and the 100 hourly simple moving average.
A bearish break below the $0.1720 support and the 100 hourly SMA may perhaps push the price below $0.1700. The next major support is near the $0.1680 level, below which the bears are likely to aim a test of the $0.1620 support area in the near term.
Technical Indicators
Hourly MACD – The MACD for XRP/USD is slowly gaining momentum in the bullish zone.
Hourly RSI (Relative Strength Index) – The RSI for XRP/USD is rising towards the 60 level.
Major Support Levels – $0.1720, $0.1700 and $0.1620.
Major Resistance Levels – $0.1760, $0.1780 and $0.1880.
Take advantage of the trading opportunities with Plus500
Risk disclaimer: 76.4% of retail CFD accounts lose money.