Reason to trust

How Our News is Made
Strict editorial policy that focuses on accuracy, relevance, and impartiality
Ad discliamer
Morbi pretium leo et nisl aliquam mollis. Quisque arcu lorem, ultricies quis pellentesque nec, ullamcorper eu odio.
- Ripple price extended its rally above the $0.4500 and $0.4700 resistances against the US dollar.
- The price tested the $0.4800 area and it looks set to extend gains above $0.5000.
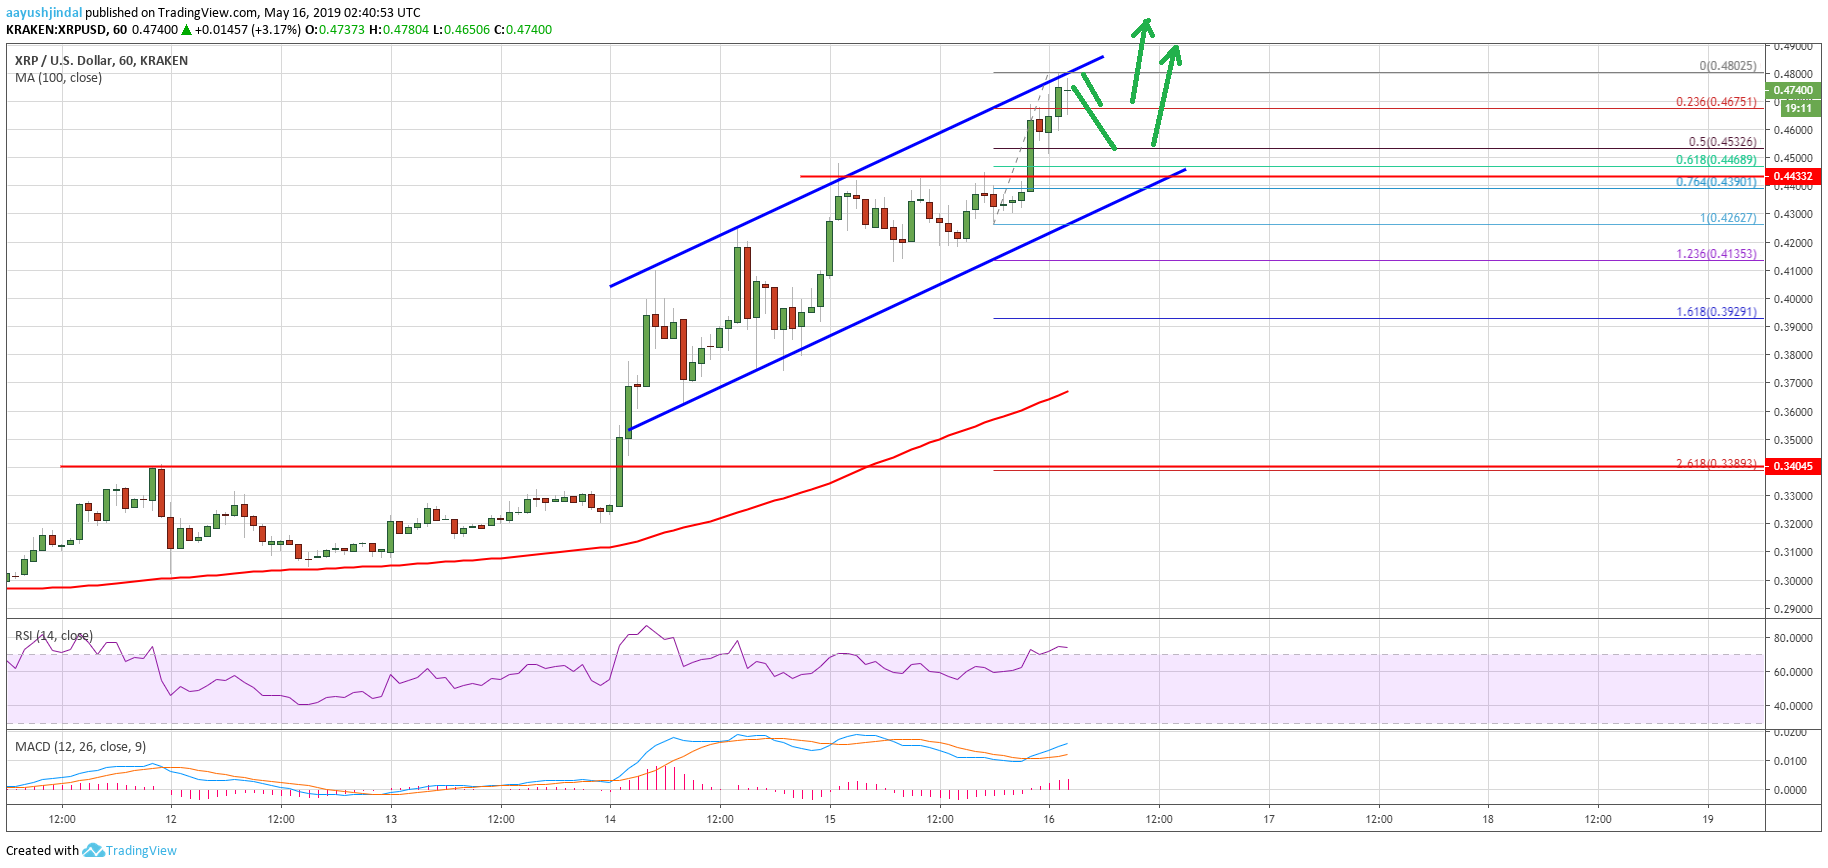
- Yesterday’s highlighted important ascending channel is intact with support near $0.4390 on the hourly chart of the XRP/USD pair (data source from Kraken).
- There were sharp gains in Ethereum above $250 and $260, opening the doors for $300.
Ripple price started a significant upward move against the US Dollar and bitcoin. XRP broke $0.4750 and it looks set to surpass $0.5000 or even $0.5200 in the near term.
Ripple Price Analysis
In the past few sessions, ripple price gained a strong bullish momentum above the $0.4200 resistance against the US Dollar. The XRP/USD pair surged above the $0.4400 and $0.4500 resistance levels to register more than 15% gains. The upward move was such that the price even broke the $0.4750 resistance and the price is now trading well above the 100 hourly simple moving average. A swing high is formed at $0.4802 and the price remains elevated above the $0.4700 level.
An initial support is near the $0.4670 level. It coincides with the 23.6% Fib retracement level of the recent wave from the $0.4262 low to $0.4802 high. If there is a downside extension, the price could test the $0.4540 or $0.4520 support levels. The 50% Fib retracement level of the recent wave from the $0.4262 low to $0.4802 high is also near $0.4532 to act as a strong support for the bulls. More importantly, yesterday’s highlighted important ascending channel is intact with support near $0.4390 on the hourly chart of the XRP/USD pair.
Therefore, dips remains well supported near $0.4540 and $0.4400 in the near term. On the upside, a break above the channel resistance and $0.4810 is likely to set the pace for more gains. An immediate resistance could be $0.4920, above which the price is likely to test the main $0.5000 barrier. Any further gains may perhaps clear the path for a push towards the $0.5200 level.

Looking at the chart, ripple price is following a strong uptrend above the $0.4400 and $0.4500 support. It seems like the price is readying for the next leg above the $0.4850 and $0.4920. If there is a downside correction, the bulls are likely to buy aggressively near the $0.4540 and $0.4520 support levels.
Technical Indicators
Hourly MACD – The MACD for XRP/USD is currently gaining momentum in the bullish zone, with strong positive signs.
Hourly RSI (Relative Strength Index) – The RSI for XRP/USD is currently above the 70 level and it is likely climbing towards 80.
Major Support Levels – $0.4540, $0.4520 and $0.4400.
Major Resistance Levels – $0.4810, $0.4920 and $0.5000.


