Reason to trust
How Our News is Made
Strict editorial policy that focuses on accuracy, relevance, and impartiality
Ad discliamer
Morbi pretium leo et nisl aliquam mollis. Quisque arcu lorem, ultricies quis pellentesque nec, ullamcorper eu odio.
- Ripple price formed a decent support near the $0.3100 level and moved higher against the US dollar.
- The price broke the $0.3150 resistance, but upsides remain capped near the $0.3200 level.
- There was a break above a key bearish trend line with resistance at $0.3145 on the hourly chart of the XRP/USD pair (data source from Kraken).
- The pair faced a strong resistance near $0.3200 and it corrected towards the $0.3150 support.
Ripple price failed to hold gains against the US Dollar, but upsides were limited versus bitcoin. XRP/USD is currently consolidating above $0.3140 and it could slowly move higher.
Ripple Price Analysis
Recently, ripple price formed a solid support near the $0.3100 level against the US Dollar. The XRP/USD pair started a nice upward move and traded above the $0.3120 and $0.3140 resistance levels. There was even a close above the $0.3140 resistance and the 100 hourly simple moving average. The upward move was strong as the price cleared the 76.4% Fib retracement level of the last drop from the $0.3185 high to $0.3095 low.
Besides, there was a break above a key bearish trend line with resistance at $0.3145 on the hourly chart of the XRP/USD pair. The pair climbed above the $0.3180 level, but it faced a strong resistance near the $0.3200 level. The current price action in bitcoin and Ethereum seems to be positive, but ripple failed to remain in a positive zone. It corrected lower below $0.3180 and the 23.6% Fib retracement level of the recent wave from the $0.3094 low to $0.3201 high.
However, the $0.3150 level is acting as a support, which was a resistance earlier. The 50% Fib retracement level of the recent wave from the $0.3094 low to $0.3201 high also acted as a hurdle. At the moment, it seems like there is a short term channel formed with support at $0.3150. Therefore, as long as the price is above $0.3150, there are chances of a fresh upside towards the $0.3200 barrier.
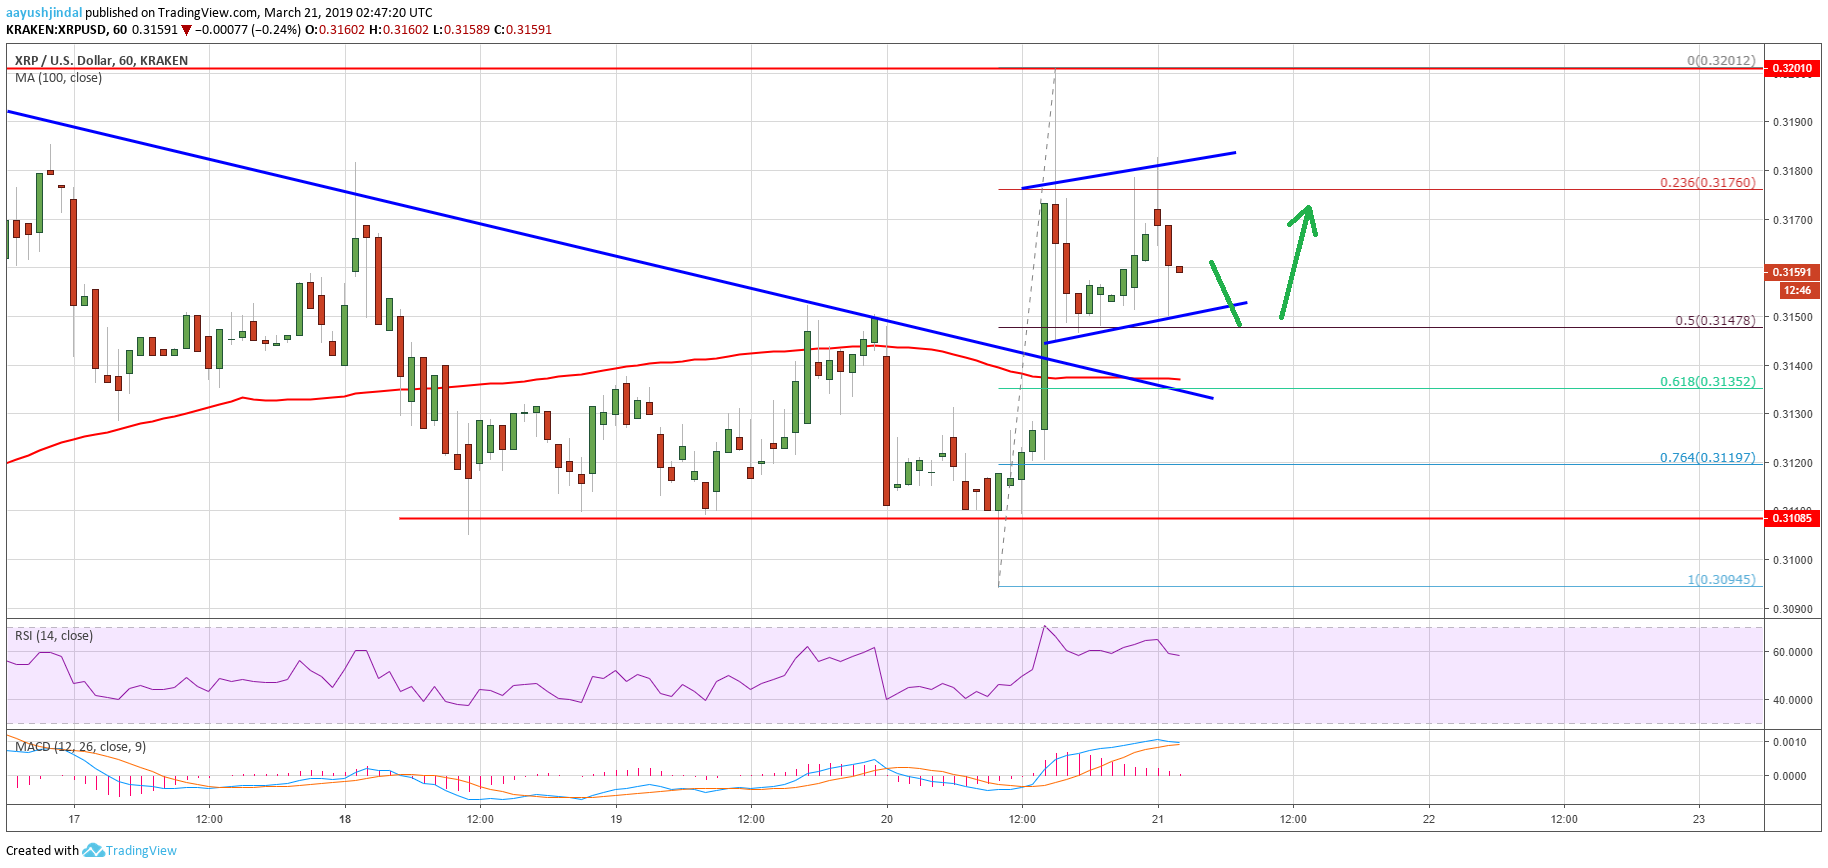
Looking at the chart, ripple price is clearly struggling to clear the $0.3200 barrier. If there is a bearish break below the $0.3150 and $0.3140 supports, there is a risk of a fresh drop. The next key support is at $0.3100, which prevented losses on many occasions in the past three days. Overall, traders can keep a close eye on $0.3140 for the next move in the near term.
Technical Indicators
Hourly MACD – The MACD for XRP/USD could move back in bearish zone.
Hourly RSI (Relative Strength Index) – The RSI for XRP/USD is currently correcting lower towards the 55 level.
Major Support Levels – $0.3150, $0.3140 and $0.3100.
Major Resistance Levels – $0.3180, $0.3185 and $0.3200.