
Reason to trust
How Our News is Made
Strict editorial policy that focuses on accuracy, relevance, and impartiality
Ad discliamer
Morbi pretium leo et nisl aliquam mollis. Quisque arcu lorem, ultricies quis pellentesque nec, ullamcorper eu odio.
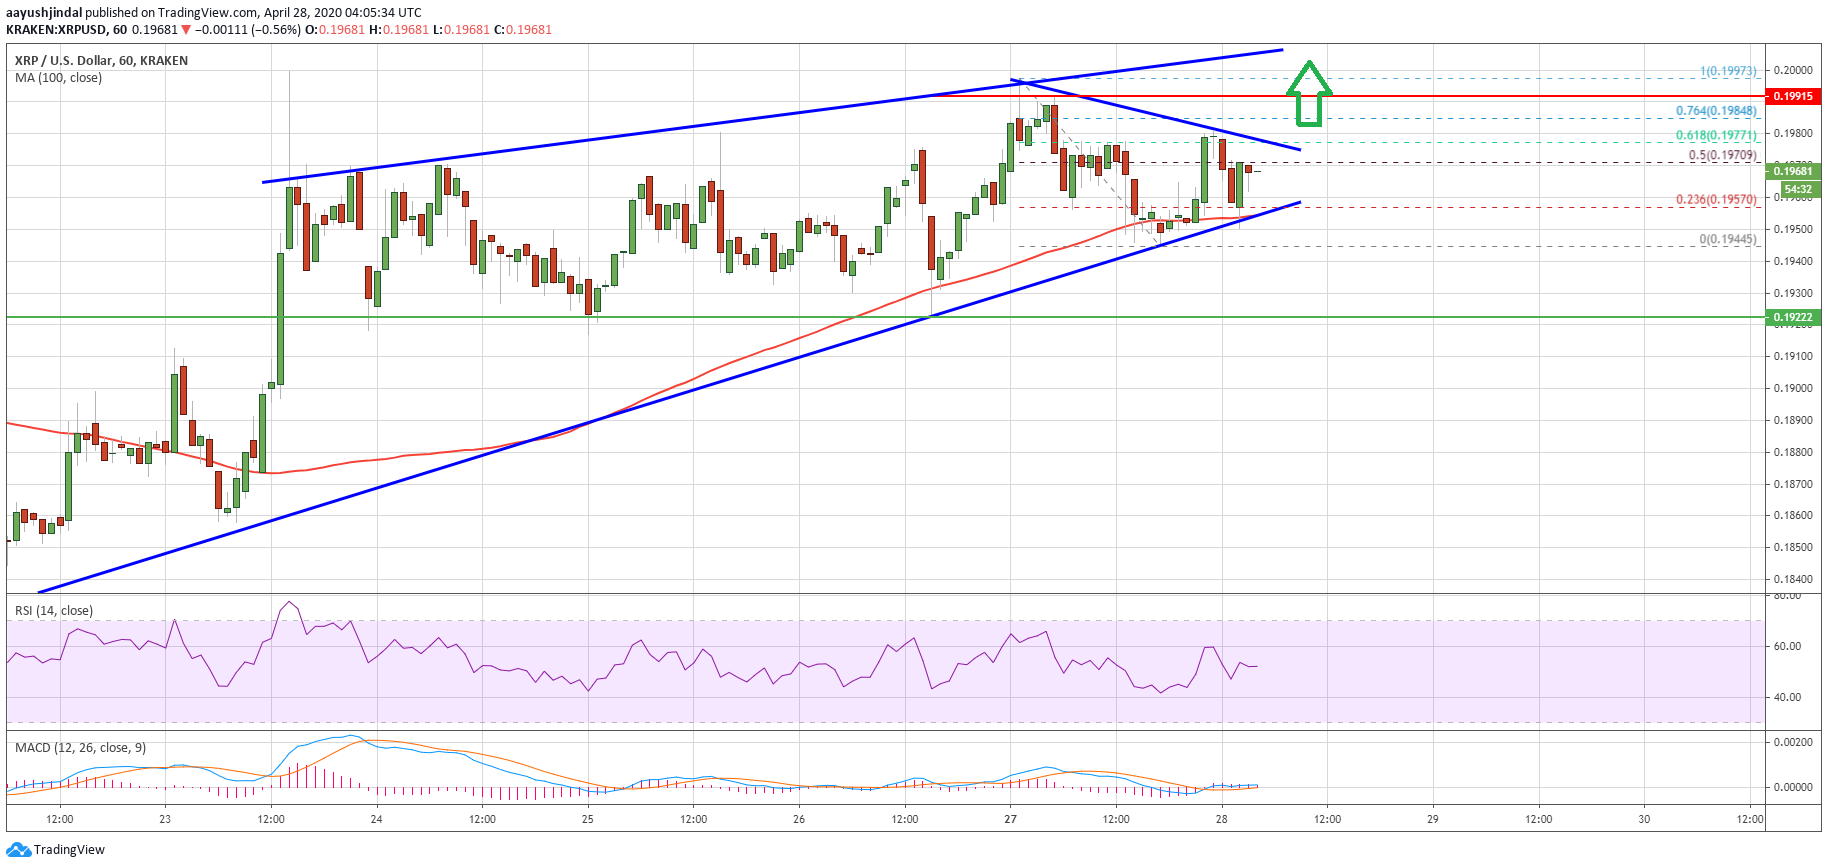
Ripple is currently correcting lower from the $0.2000 support against the US Dollar. XRP price is likely to start a fresh increase unless there is a clear break below $0.1920.
- Ripple price is correcting lower from the $0.1997 weekly high against the US dollar.
- The bulls are protecting the $0.1950 support and the 100 hourly simple moving average.
- There is a crucial bullish trend line forming with support near $0.1960 on the hourly chart of the XRP/USD pair (data source from Kraken).
- The pair is likely to surge above $0.2000 as long as it is above the $0.1920 support zone.
Ripple Price Remains Supported
Recently, ripple spiked above the $0.1980 resistance area and tested the $0.2000 hurdle. XRP price traded as high as $0.1997 and failed to extend gains above $0.2000.
It started a downside correction and traded below the $0.1965 support. However, the $0.1950 level acted as a strong support along with the 100 hourly simple moving average.
A low is formed near $0.1944 and the price is currently following a bullish breakout pattern. It surpassed the 50% Fib retracement level of the recent decline from the $0.1997 high to $0.1944 low.
On the upside, the bulls are facing hurdles near the $0.1980 level and a connecting bearish trend line on the hourly chart of the XRP/USD pair. Ripple is also struggling to clear the 61.8% Fib retracement level of the recent decline from the $0.1997 high to $0.1944 low.
If there is an upside break above the $0.1980 resistance, the price could revisit the $0.2000 resistance area. A successful break and follow through above the $0.2000 hurdle is must for another surge.
An immediate resistance above $0.2000 is near the $0.2020 level, above which the bulls are likely to aim a test of the $0.2120 level.
Downside Break?
Ripple is clearly trading near a major support above $0.1955 and the 100 hourly simple moving average. There is also a crucial bullish trend line forming with support near $0.1960 on the same chart.
If the price fails to stay above the trend line and the 100 hourly SMA, it could correct further lower below $0.1950. The next major support is near $0.1920, below which there is a risk of a strong decline towards $0.1850.
Technical Indicators
Hourly MACD – The MACD for XRP/USD is losing pace in the bullish zone.
Hourly RSI (Relative Strength Index) – The RSI for XRP/USD is currently near the 50 level.
Major Support Levels – $0.1950, $0.1920 and $0.1880.
Major Resistance Levels – $0.1980, $0.2000 and $0.2020.
Take advantage of the trading opportunities with Plus500
Risk disclaimer: 76.4% of retail CFD accounts lose money.