Reason to trust
How Our News is Made
Strict editorial policy that focuses on accuracy, relevance, and impartiality
Ad discliamer
Morbi pretium leo et nisl aliquam mollis. Quisque arcu lorem, ultricies quis pellentesque nec, ullamcorper eu odio.
Ripple is facing a strong resistance near the $0.1500 region against the US Dollar. However, XRP price remains well supported above $0.1400 and it could soon start an increase towards $0.1700.
- Ripple price is trading in a key range above the $0.1400 support level against the US dollar.
- There are a few key hurdles forming near the $0.1500 and $0.1550 levels.
- There is a major contracting triangle forming with resistance near $0.1485 on the hourly chart of the XRP/USD pair (data source from Kraken).
- The price is likely to accelerate higher once it clears the $0.1485 and $0.1500 resistance levels.
Ripple Price is Stuck in a Range
In the past few sessions, ripple remained well bid above the $0.1320 and $0.1400 support levels. XRP price recovered further and climbed above the $0.1450 level.
The bulls even pushed the price above the $0.1500 level, but they failed to gain strength. The price topped near the $0.1549 level and it remained below the 100 hourly simple moving average.
There were mostly contracting range moves below the $0.1500 and $0.1550 resistance levels. Besides, ripple price tested the 50% Fib retracement level of the recovery wave from the $0.1280 low to $0.1549 high.
It seems like there is a major contracting triangle forming with resistance near $0.1485 on the hourly chart of the XRP/USD pair. On the upside, there is a key resistance forming near $0.1485 and the 100 hourly SMA.
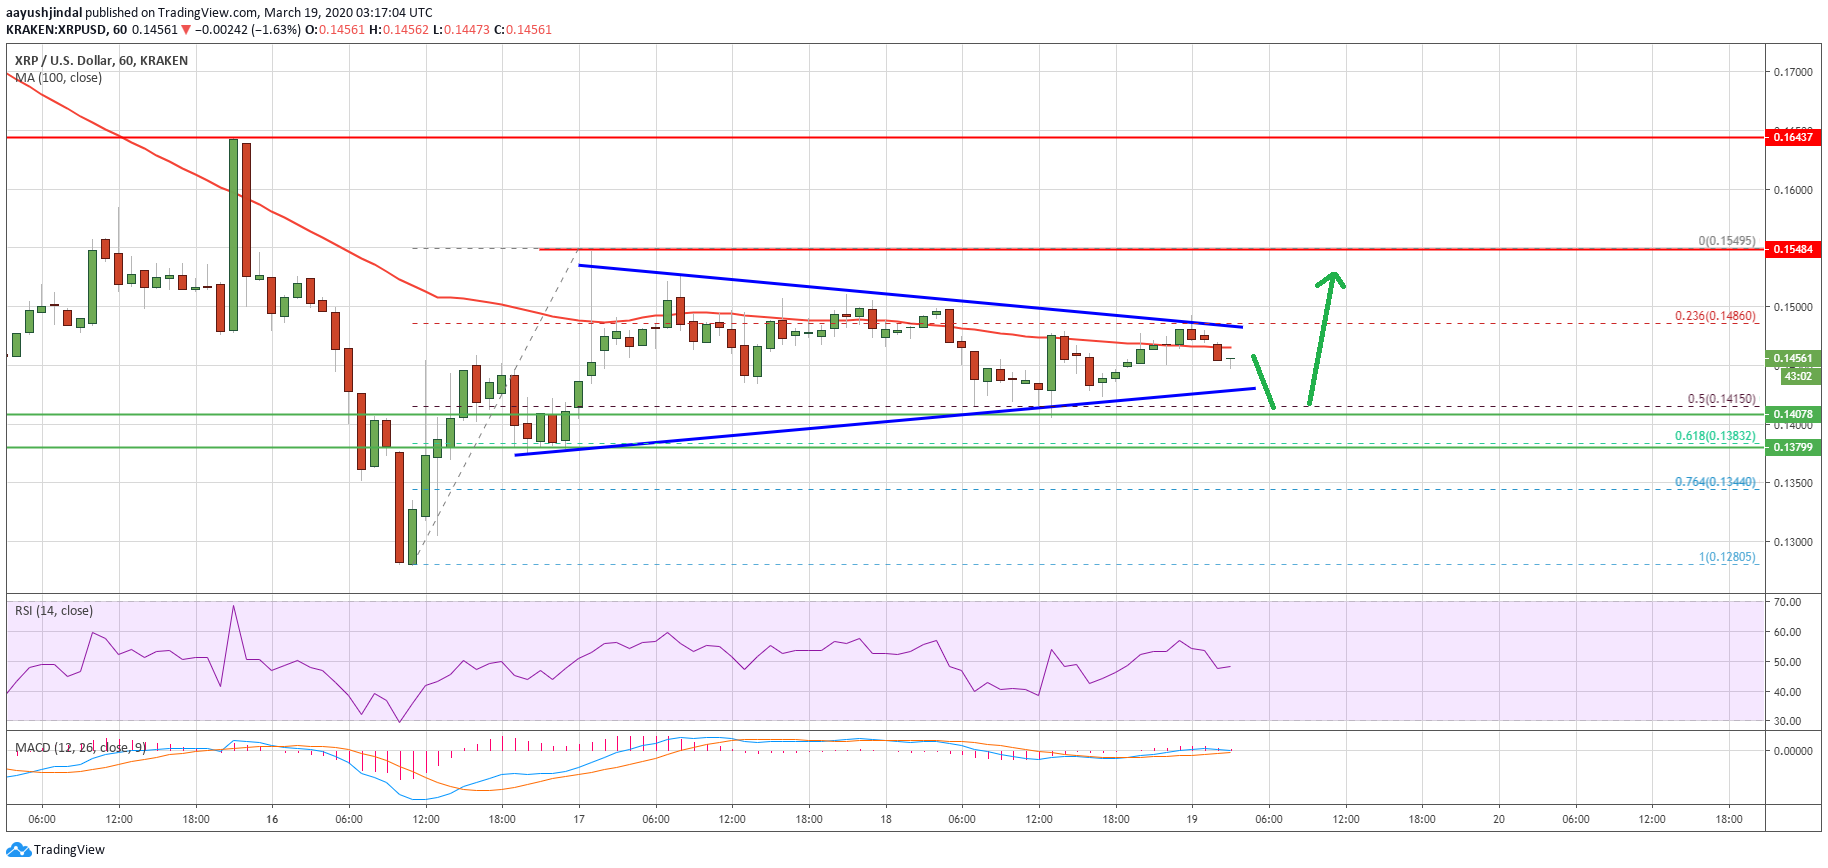
A successful break above the $0.1485 level and then a follow through above $0.1500 might open the doors for a decent upward move. The next resistance is near the $0.1550 level, above which the price is likely to test the main $0.1700 resistance area.
Range Break?
If ripple fails to surpass the $0.1485 and $0.1500 resistance levels, it could attempt a downside break. The first key support is near the $0.1400 level.
The next support is near the $0.1384 level. It represents the 61.8% Fib retracement level of the recovery wave from the $0.1280 low to $0.1549 high.
If there is a downside break below the $0.1384 level, there is a risk of a larger decline in the coming sessions. The next major support is seen near the $0.1300 and $0.1285 levels.
Technical Indicators
Hourly MACD – The MACD for XRP/USD is currently showing no major bullish sign.
Hourly RSI (Relative Strength Index) – The RSI for XRP/USD is currently rising and it is close to the 50 level.
Major Support Levels – $0.1400, $0.1384 and $0.1300.
Major Resistance Levels – $0.1485, $0.1500 and $0.1550.


