Reason to trust
How Our News is Made
Strict editorial policy that focuses on accuracy, relevance, and impartiality
Ad discliamer
Morbi pretium leo et nisl aliquam mollis. Quisque arcu lorem, ultricies quis pellentesque nec, ullamcorper eu odio.
Ripple extended its rally above the $0.2200 resistance against the US Dollar. XRP price is showing many positive signs and it could continue to rise towards $0.2500 or $0.2600.
- Ripple price is up close to 10% and it climbed above the $0.2300 level against the US dollar.
- It tested the $0.2350 resistance and currently consolidating gains.
- There is a key bullish trend line forming with support near $0.2280 on the hourly chart of the XRP/USD pair (data source from Kraken).
- The pair remains in a nice uptrend and it could continue to rise towards the $0.2500 resistance level.
Ripple Price Breaks Key Hurdle
This week, there was a strong uptrend in ripple above the $0.2000 resistance. Yesterday’s XRP price fueled bitcoin and it rallied more than 15% to test the $9,000 resistance level today.
XRP price is following a nice uptrend and it recently surged above the $0.2200 and $0.2300 resistance levels. The bulls even pushed the price towards the $0.2350 resistance, with a strong close above the 100 hourly simple moving average.
A new monthly high is formed near $0.2356 and the price is currently consolidating gains. An initial support is near the $0.2285 level. It is close to the 23.6% Fib retracement level of the recent surge from the $0.2051 swing low to $0.2356 high.
Moreover, there is a key bullish trend line forming with support near $0.2280 on the hourly chart of the XRP/USD pair. If ripple fails to stay above the $0.2280 support level, there could be an extended decline.
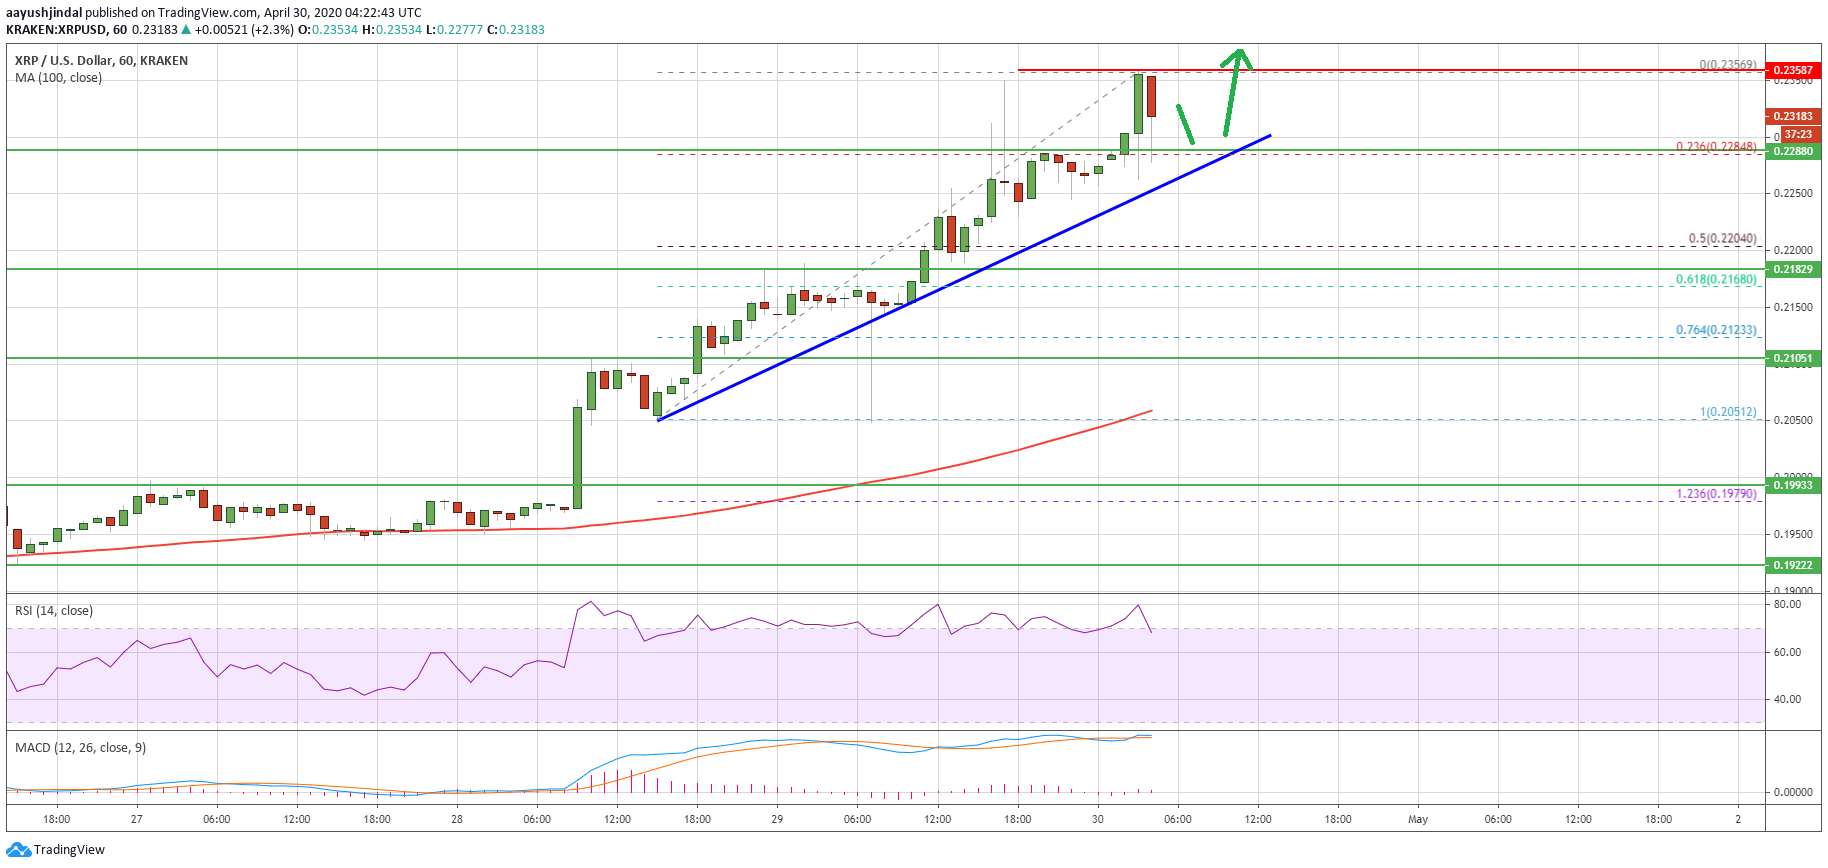
The next major support is seen near the $0.2200 level or the 50% Fib retracement level of the recent surge from the $0.2051 swing low to $0.2356 high. Any further losses could lead the price towards the $0.2120 support or even 100 hourly simple moving average.
More Upsides?
Ripple is clearly trading in a strong uptrend above the $0.2280 support area. On the upside, an initial resistance is near the $0.2350 level.
If there is a clear break above the $0.2350 resistance and the $0.2356 high, the price could continue to rise towards the $0.2500 resistance. The next major hurdle above $0.2500 is near the $0.2600 level.
Technical Indicators
Hourly MACD – The MACD for XRP/USD is slowly reducing its current bullish slope.
Hourly RSI (Relative Strength Index) – The RSI for XRP/USD is currently correcting lower from the 80 level.
Major Support Levels – $0.2280, $0.2200 and $0.2120.
Major Resistance Levels – $0.2350, $0.2420 and $0.2500.
Take advantage of the trading opportunities with Plus500
Risk disclaimer: 76.4% of retail CFD accounts lose money.