Reason to trust
How Our News is Made
Strict editorial policy that focuses on accuracy, relevance, and impartiality
Ad discliamer
Morbi pretium leo et nisl aliquam mollis. Quisque arcu lorem, ultricies quis pellentesque nec, ullamcorper eu odio.
- Ripple price recovered recently above $0.3100, but struggled to break $0.3140 against the US dollar.
- The price is currently declining and it might even break the $0.3050 support area in the near term.
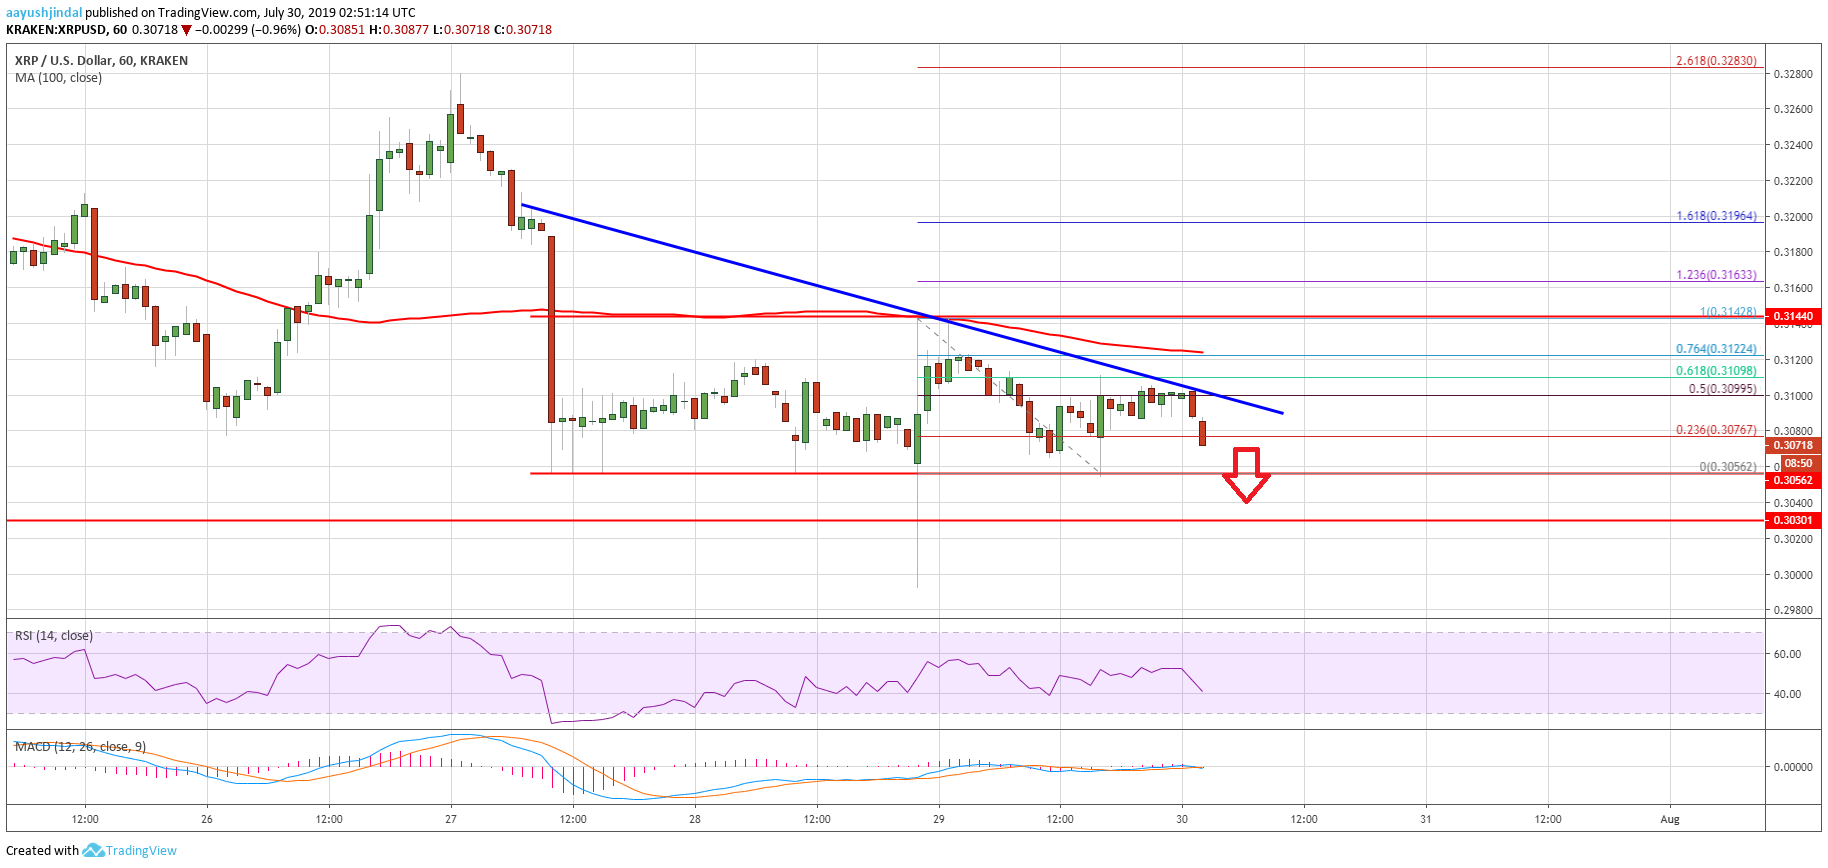
- There is a key bearish trend line forming with resistance near $0.3105 on the hourly chart of the XRP/USD pair (data source from Kraken).
- The price remains at a risk of more downsides as long as there is no break above $0.3140-0.3150.
Ripple price is currently following a bearish pattern against the US Dollar, similar to bitcoin. XRP price could decline heavily if there is a daily close below the $0.3030 support.
Ripple Price Analysis
After a sharp decline, there was an upside correction in bitcoin, Ethereum and ripple against the US Dollar. The XRP/USD pair traded as low as $0.2992 and recovered above the $0.3050 and $0.3100 levels. Moreover, the price recovered above the $0.3120 resistance level. However, the recovery was capped by the $0.3140 resistance zone. The 100 hourly simple moving average (currently at $0.3122) also prevented an upside break.
A swing high was formed near $0.3142 and the price recently corrected lower. The $0.3050 support level prevented a downside break and the price moved back above $0.3080. Additionally, there was a break above the 50% Fib retracement level of the downward move from the $0.3142 high to $0.3056 low. However, the bulls were not able to gain momentum and the price was capped near $0.4100.
The 61.8% Fib retracement level of the downward move from the $0.3142 high to $0.3056 low acted as a resistance. More importantly, there is a key bearish trend line forming with resistance near $0.3105 on the hourly chart of the XRP/USD pair. Above the trend line, the 100 hourly SMA is near the $0.3120 level to cap gains. The main resistance is near the $0.3140-0.3150 area, above which the price could start a strong upward move.
Conversely, if the price fails to break the $0.3100 or $0.3120 resistance, it could continue to slide. An immediate support is near the $0.3050 level. The main support is near $0.3030. If there is a daily close below the $0.3030 and $0.3020 support levels, the price could decline heavily towards $0.2850.
Looking at the chart, ripple price is clearly trading in a downtrend below $0.3140. Having said that, the $0.3030 support holds the key. As long as the price is above $0.3030, it could stage a solid recovery above $0.3140.
Technical Indicators
Hourly MACD – The MACD for XRP/USD is moving into the bearish zone.
Hourly RSI (Relative Strength Index) – The RSI for XRP/USD is moving lower towards the 40 level.
Major Support Levels – $0.3050, $0.3030 and $0.3000.
Major Resistance Levels – $0.3100, $0.3120 and $0.3140.