Reason to trust
How Our News is Made
Strict editorial policy that focuses on accuracy, relevance, and impartiality
Ad discliamer
Morbi pretium leo et nisl aliquam mollis. Quisque arcu lorem, ultricies quis pellentesque nec, ullamcorper eu odio.
- Ripple price is gaining bullish momentum above the $0.2600 resistance area against the US dollar.
- The price is up around 5% and it recently broke the $0.2650 resistance area.
- There is a connecting bullish trend line forming with support near $0.2550 on the hourly chart of the XRP/USD pair (data source from Kraken).
- The price remains supported on dips and it could continue to rise towards the $0.2720 resistance.
Ripple price is rallying towards $0.2720 against the US Dollar, while bitcoin and Ethereum are sliding. XRP price might continue to rise towards $0.2720 or $0.2750.
Ripple Price Analysis
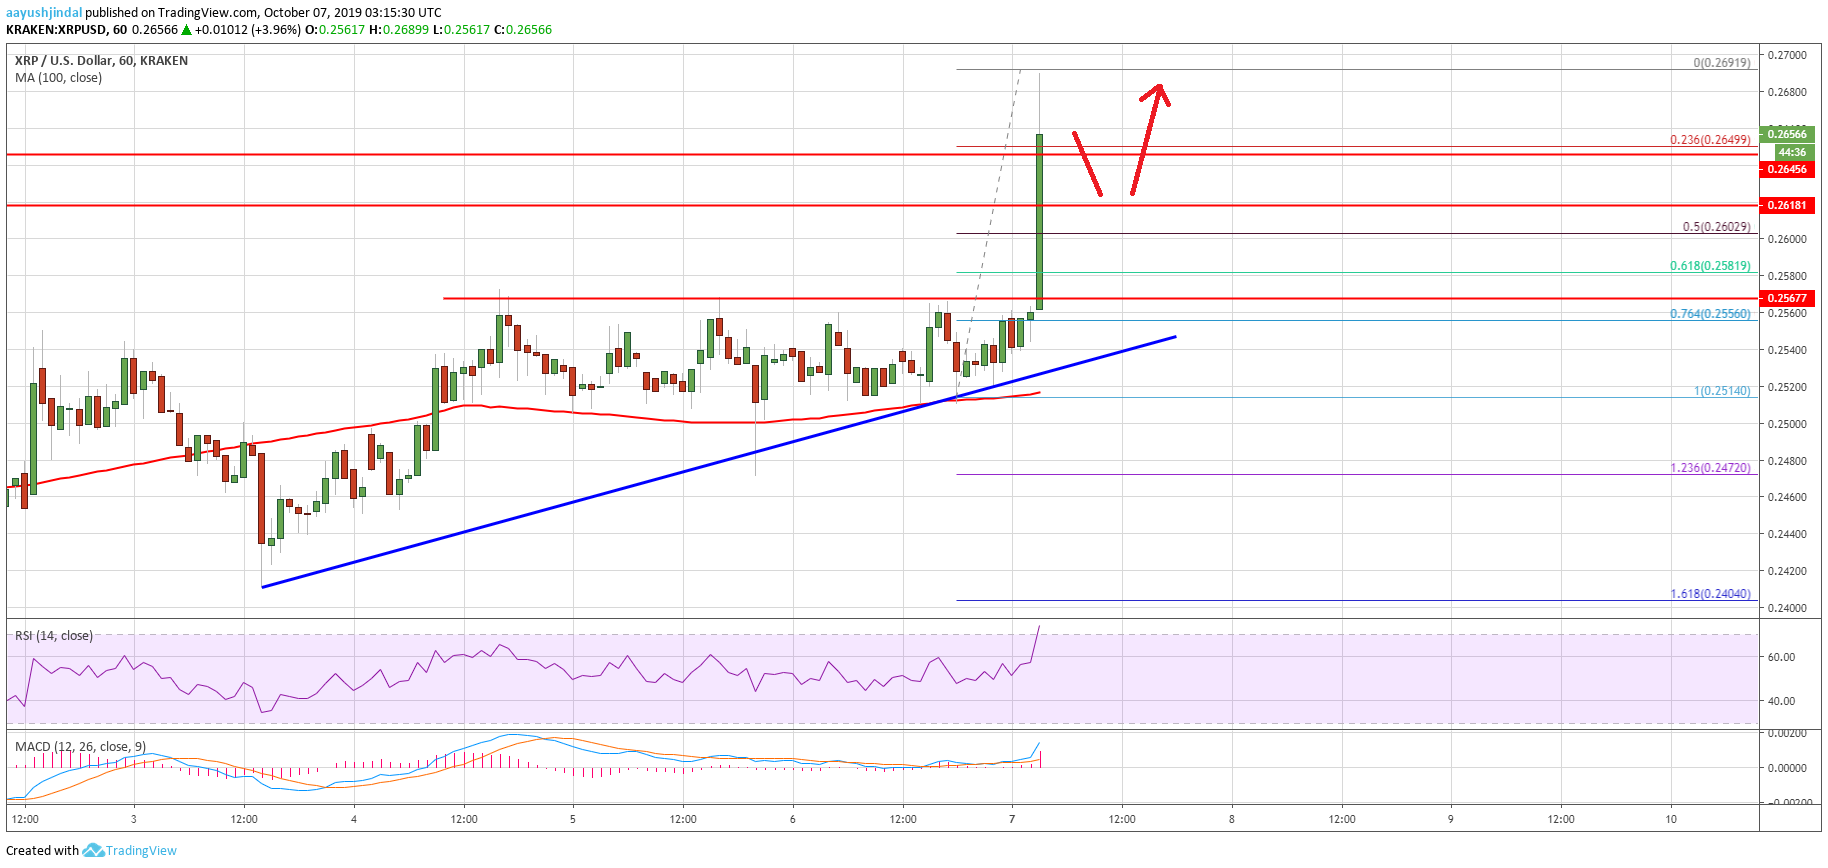
This past week, ripple price made many attempts to surpass the $0.2620 and $0.2650 resistance levels against the US Dollar. However, the XRP/USD pair failed to climb above $0.2650 and traded in a range. Finally, the bulls had an upper hand and the price rallied recently after forming a base near $0.2550. There was a sharp rise above the $0.2600 resistance and the 100 hourly simple moving average.
Moreover, the price broke the $0.2620 and $0.2650 resistance levels. It opened the doors for more gains and the price traded towards the $0.2700 level. A high was formed near $0.2691 and the price is currently retreating from highs. An immediate support is near the $0.2650 level. It coincides with the 23.6% Fib retracement level of the recent rally from the $0.2514 low to $0.2691 high.
On the downside, there are many supports near the $0.2620 and $0.2600 levels. Additionally, the 50% Fib retracement level of the recent rally from the $0.2514 low to $0.2691 high is near $0.2600. More importantly, there is a connecting bullish trend line forming with support near $0.2550 on the hourly chart of the XRP/USD pair. Therefore, dips from the current levels might find bids near $0.2620 or $0.2600.
The main support is near the $0.2550 level (the previous support base). On the upside, an immediate resistance is near the $0.2700 level. If there is an upside break above $0.2700, the price could test $0.2720 or even $0.2750 in the near term.
Looking at the chart, ripple price is clearly surging with a positive bias above $0.2620. There are high chances of it extending gains above the $0.2700 and $0.2720 resistance levels in the coming sessions. Conversely, if there is a downside correction, the bulls might protect the $0.2650 and $0.2620 levels (the previous resistance levels).
Technical Indicators
Hourly MACD – The MACD for XRP/USD is currently gaining pace in the bullish zone.
Hourly RSI (Relative Strength Index) – The RSI for XRP/USD is currently well above the 60 level, with bullish signs.
Major Support Levels – $0.2650, $0.2620 and $0.2550.
Major Resistance Levels – $0.2700, $0.2720 and $0.2750.