
Reason to trust
How Our News is Made
Strict editorial policy that focuses on accuracy, relevance, and impartiality
Ad discliamer
Morbi pretium leo et nisl aliquam mollis. Quisque arcu lorem, ultricies quis pellentesque nec, ullamcorper eu odio.
Key Highlights
- Ripple price traded as high as $1.1024 before starting a downside correction against the US dollar.
- Yesterday’s highlighted ascending channel with current support at $1.0080 is intact on the hourly chart of the XRP/USD pair (data source from SimpleFx).
- The pair may extend the current decline, but it is likely to find support near $1.0000 and $1.0080.
Ripple price is currently correcting lower against the US Dollar and Bitcoin. XRP/USD remains well supported on the downside above the $1.00 handle.
Ripple Price Support
Recently, we saw a nice upside move in Ripple price above the $1.00 level against the US Dollar. The price traded above the $1.10 level and formed a high at $1.1024. Later, a downside wave was initiated and the price moved below the 23.6% Fib retracement level of the last wave from the $0.9136 low to $1.1024 high. However, there are many supports on the downside such as $1.0000 and $1.0080.
More importantly, yesterday’s highlighted ascending channel with current support at $1.0080 is intact on the hourly chart of the XRP/USD pair. The pair extend the current correction pattern, but the channel support and $1.00 are major buy zones. Furthermore, the channel support is near the 50% Fib retracement level of the last wave from the $0.9136 low to $1.1024 high. The last but not the least, the 100 hourly simple moving average is also positioned around the channel support and $1.00 to prevent declines.
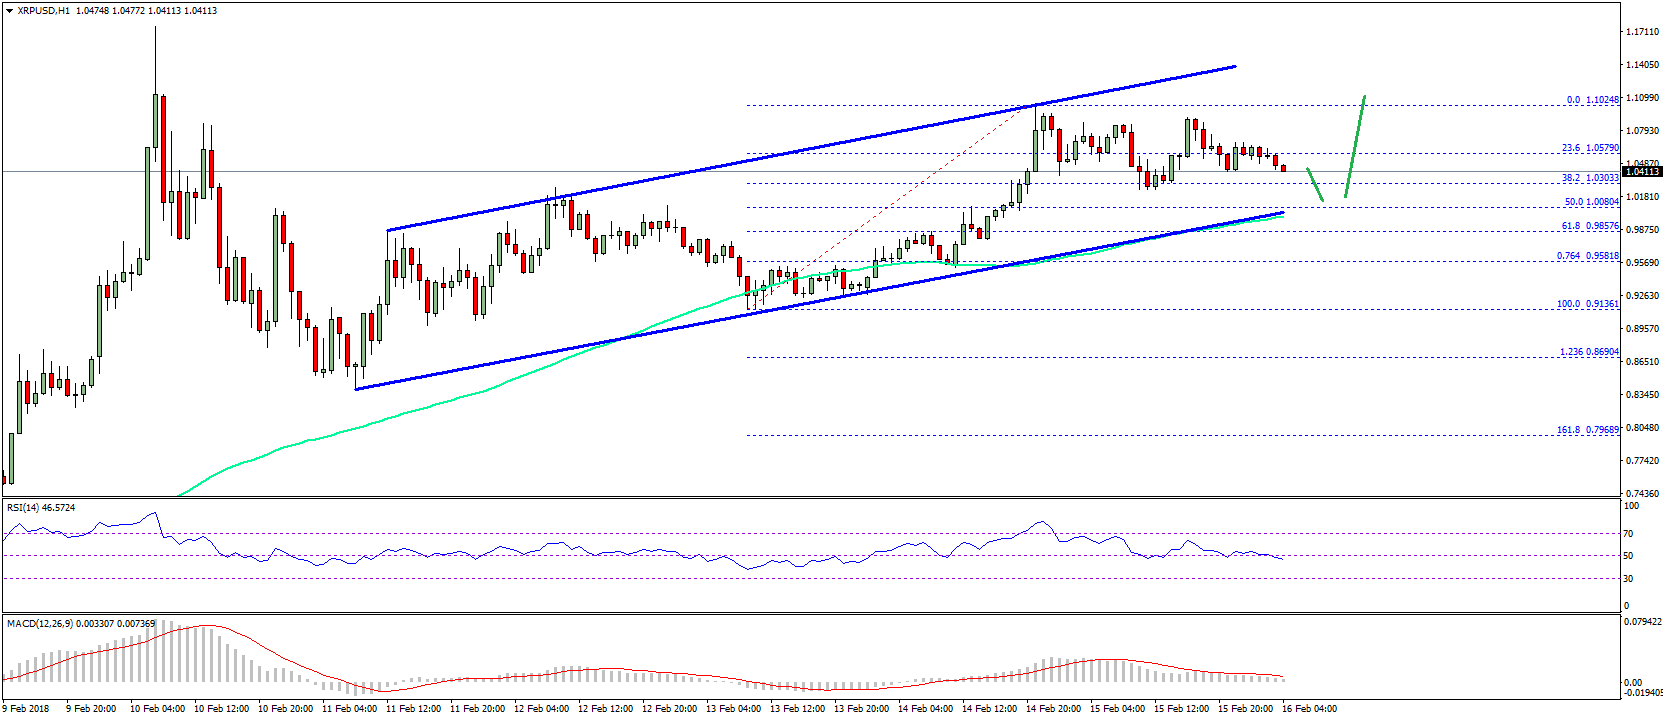
Therefore, the $1.00 handle is a major buy zone. A break below $1.00 could push the price back in the bearish zone. On the upside, an initial resistance is at $1.10. Above $1.10, the price has to surpass $1.15 for more gains.
Looking at the technical indicators:
Hourly MACD – The MACD for XRP/USD is currently reducing its bullish slope.
Hourly RSI (Relative Strength Index) – The RSI for XRP/USD is struggling to stay above the 50 level.
Major Support Level – $1.0000
Major Resistance Level – $1.1100
Charts courtesy – SimpleFX


This 2 day hovering is due to Asian holidays. 50% of all XRP is trade in S Korea. There for was the big decline in Januar (S Korean regulation). I bet “all in” that there will be a masive corection up shortly.
Correction positive or negative?
He said up, and I’m sure he’s right
Ripple will rise in 2018 at steady rate.