
Reason to trust
How Our News is Made
Strict editorial policy that focuses on accuracy, relevance, and impartiality
Ad discliamer
Morbi pretium leo et nisl aliquam mollis. Quisque arcu lorem, ultricies quis pellentesque nec, ullamcorper eu odio.
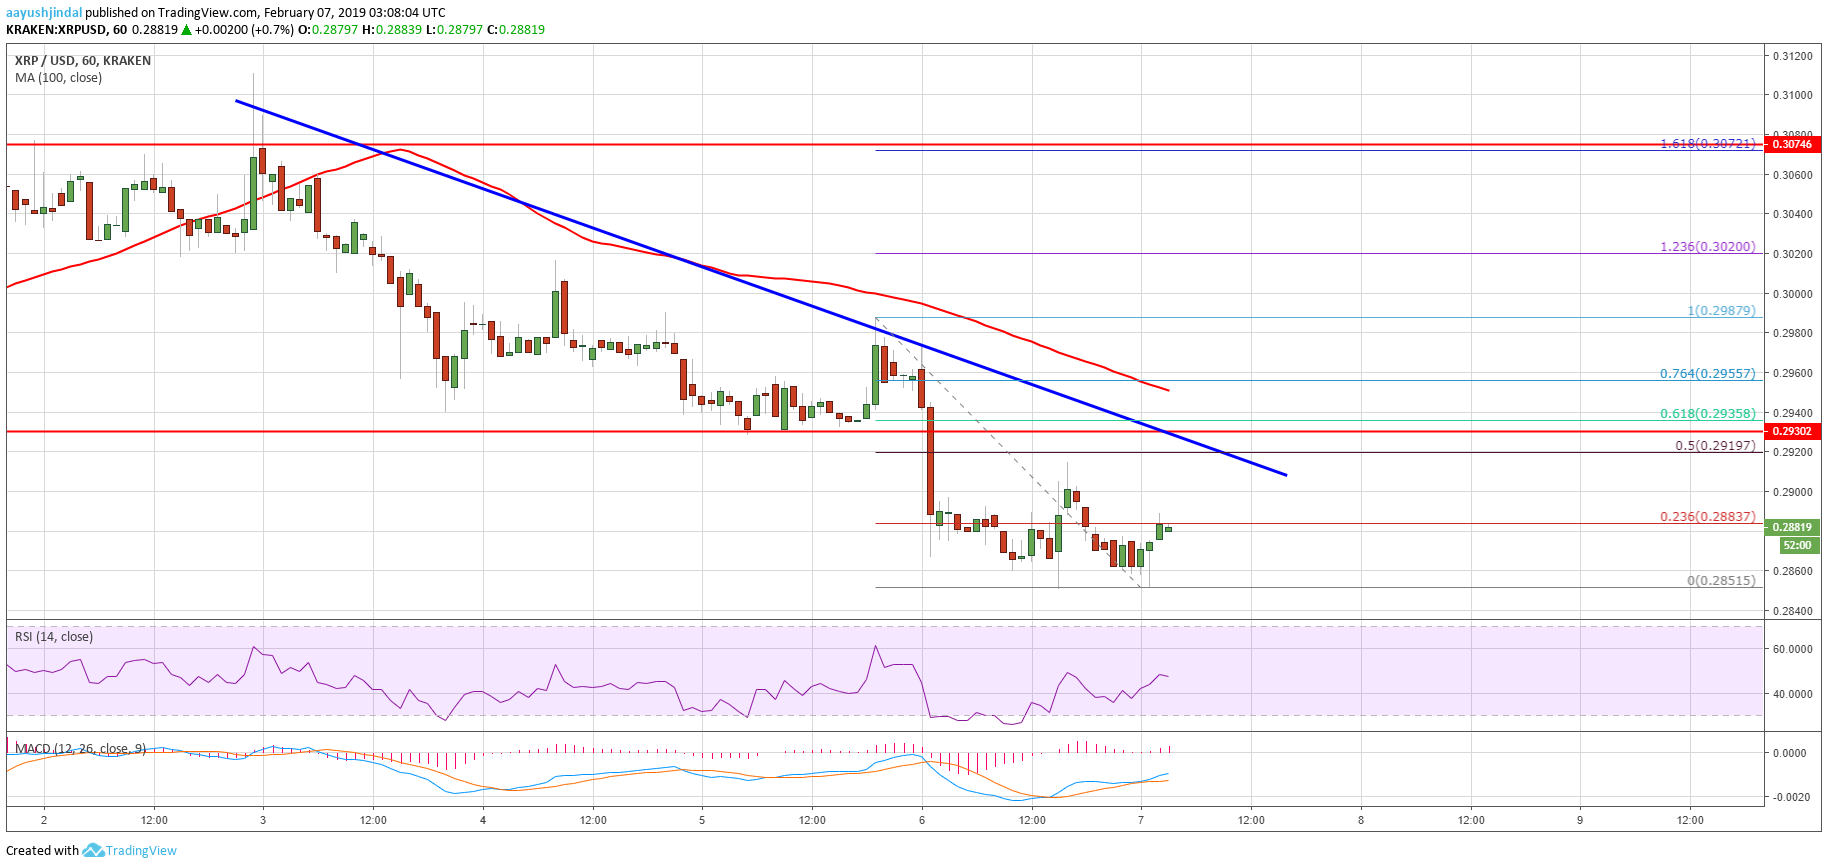
- Ripple price extended losses and tested the $0.2840-0.2850 support area against the US dollar.
- There is a major bearish trend line in place with resistance near $0.2920 on the hourly chart of the XRP/USD pair (data source from Kraken).
- The pair is currently correcting higher, but it is likely to face sellers near $0.2920, $0.2960 and $0.3000.
Ripple price is consolidating with corrective moves against the US Dollar and Bitcoin. XRP/USD could resume its decline once the current correction is complete near $0.2920-0.2950.
Ripple Price Analysis
Yesterday, there was a sharp decline below the $0.3000 support in ripple against the US Dollar. The XRP/USD pair remained in a bearish zone and later broke the $0.2920 and $0.2900 support levels. It tested the $0.2840-0.2850 support area and finally started a short term upside correction. The price is currently trading near the 23.6% Fib retracement level of the last decline from the $0.2987 high to $0.2851 low. However, there are many resistances on the upside near the $0.2920, $0.2960 and $0.3000 levels.
Besides, there is a major bearish trend line in place with resistance near $0.2920 on the hourly chart of the XRP/USD pair. The trend line is close to the 50% Fib retracement level of the last decline from the $0.2987 high to $0.2851 low. If there is a break above the trend line, the next resistance is near the $0.2940 and the 100 hourly simple moving average. To start a solid recovery, the price must break the $0.2950 and $0.3000 resistance levels. If not, the price remains at a risk of more losses below $0.2880 and $0.2850. The next key support below $0.2850 is at $0.2820, followed by $0.2800.
Looking at the chart, ripple price is trading well below the $0.2950 resistance and the 100 hourly SMA. Therefore, it remains in a bearish zone and any recovery from the current levels could face sellers near $0.2950.
Technical Indicators
Hourly MACD – The MACD for XRP/USD is currently in the bullish zone, but it could move back in the bearish zone.
Hourly RSI (Relative Strength Index) – The RSI for XRP/USD just moved above the 50 level.
Major Support Level – $0.2850
Major Resistance Level – $0.2950


