Reason to trust
How Our News is Made
Strict editorial policy that focuses on accuracy, relevance, and impartiality
Ad discliamer
Morbi pretium leo et nisl aliquam mollis. Quisque arcu lorem, ultricies quis pellentesque nec, ullamcorper eu odio.
- Ripple price faced a strong resistance near the $0.3330 level and declined sharply against the US dollar.
- There is a major bullish trend line in place with support at $0.2920 on the hourly chart of the XRP/USD pair (data source from Kraken).
- The pair could either climb back above the $0.3050 resistance or extend the current decline below $0.2900.
Ripple price failed to hold gains and declined heavily against the US Dollar and Bitcoin. XRP/USD remains at a risk of more losses as long as it is below $0.3050 and $0.3120.
Ripple Price Analysis
Yesterday, we saw a solid rally in ripple price above the $0.3200 resistance against the US Dollar. The XRP/USD pair even broke the $0.3300 resistance and the 100 hourly simple moving average. However, the price faced a strong resistance near the $0.3330 level and later declined sharply. It broke many supports, including $0.3300, $0.3250, $0.3150 and $0.3050. There was also a break below the 61.8% Fib retracement level of the last leg from the $0.2771 low to $0.3338 high. Moreover, there was a close below the $0.3050 support and the 100 hourly SMA.
At the moment, the price is trading just above the $0.2900 and $0.2920 supports. Besides, there is a major bullish trend line in place with support at $0.2920 on the hourly chart of the XRP/USD pair. The 76.4% Fib retracement level of the last leg from the $0.2771 low to $0.3338 high is also near $0.2905. Therefore, if there is a bearish break below $0.2920 and $0.2905, there could be a sharp decline. The next key support is at $0.2800, below which the price may test $0.2650. On the upside, the price has to break the $0.3050 resistance to avoid further losses.
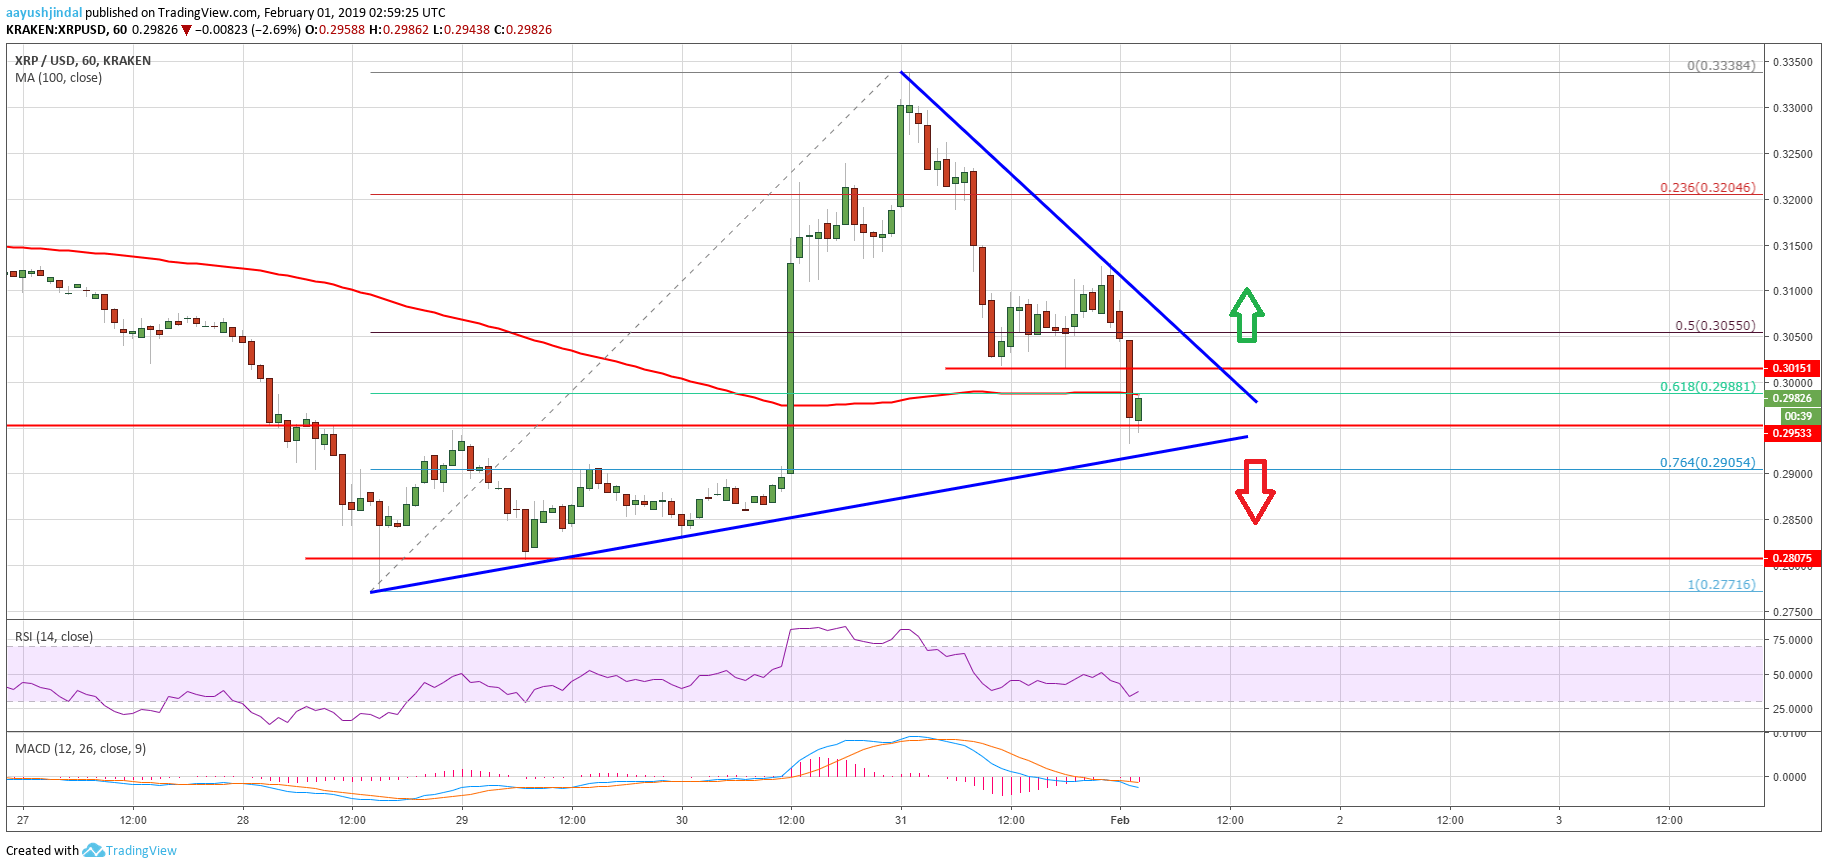
Looking at the chart, ripple price could either surge above the $0.3050-$0.3120 resistance or extend the current decline. A daily close below $0.2900 might put a lot of pressure on buyers in the short term.
Technical Indicators
Hourly MACD – The MACD for XRP/USD is showing a few positive signs in the bullish zone.
Hourly RSI (Relative Strength Index) – The RSI for XRP/USD is currently well below the 50 level.
Major Support Level – $0.2905
Major Resistance Level – $0.3120