Reason to trust
How Our News is Made
Strict editorial policy that focuses on accuracy, relevance, and impartiality
Ad discliamer
Morbi pretium leo et nisl aliquam mollis. Quisque arcu lorem, ultricies quis pellentesque nec, ullamcorper eu odio.
- Ripple price failed to retain gains and traded below the $0.3080 support against the US dollar.
- There is a key connecting bearish trend line in place with resistance at $0.3065 on the hourly chart of the XRP/USD pair (data source from Kraken).
- The pair must stay above the $0.3000 support and the 100 hourly simple moving average to bounce back.
Ripple price is currently correcting gains against the US Dollar and Bitcoin. XRP/USD is at a risk of a sharp decline if it breaks the 100 hourly SMA and $0.3000.
Ripple Price Analysis
The recent uptrend in bitcoin and Ethereum helped ripple price is climbing above $0.3000 against the US Dollar. The XRP/USD pair broke the $0.3100 resistance level and traded towards the $0.3200 level. A high was formed at $0.3199 and later the price corrected lower. It moved below the $0.3150 support and 50% Fib retracement level of the last wave from the $0.2864 low to $0.3199 high. The price even broke the $0.3000 support once and tested the 100 hourly simple moving average.
At the moment, it seems like the 100 hourly simple moving average is acting as a strong support above $0.3000. The 61.8% Fib retracement level of the last wave from the $0.2864 low to $0.3199 high also acted as a support. However, there are many resistances on the upside near the $0.3050 and $0.3060 levels. Besides, there is a key connecting bearish trend line in place with resistance at $0.3065 on the hourly chart of the XRP/USD pair. The pair needs to break the $0.3060 resistance and the bearish trend line to gain bullish momentum. If not, there is a risk of a downside break below the $0.3000 support.
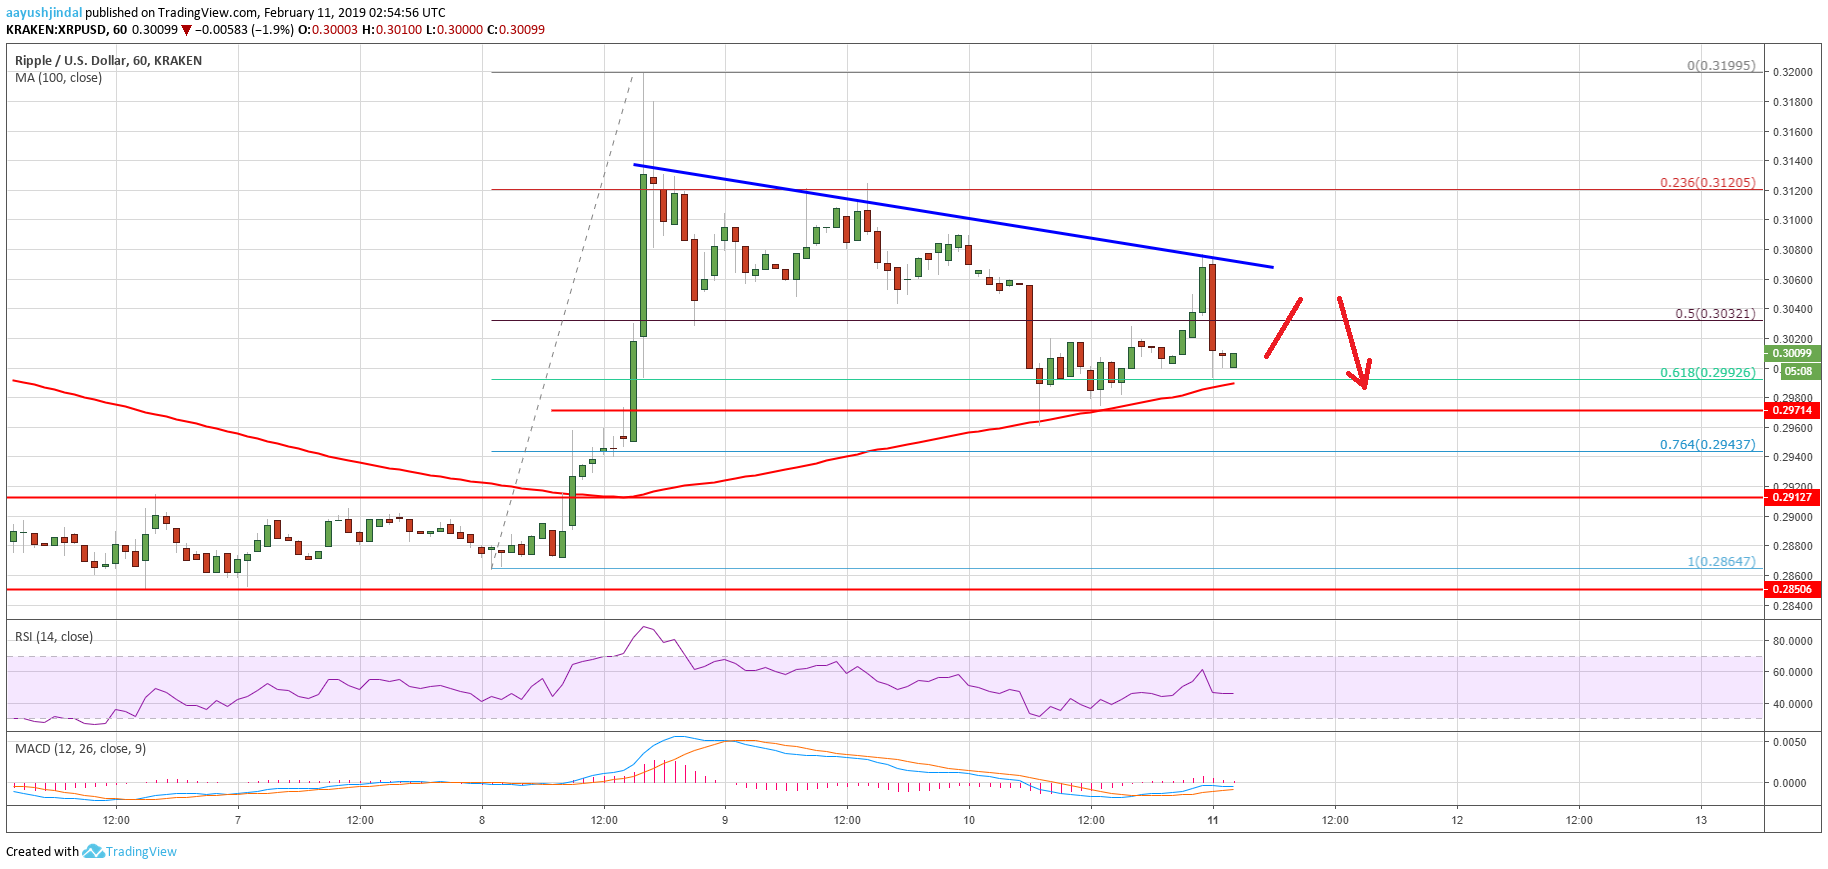
Looking at the chart, ripple price is finding a strong support near the 100 hourly SMA, below which it could tumble towards $0.2900. The next key supports are at $0.2920 and $0.2910, followed by $0.2850.
Technical Indicators
Hourly MACD – The MACD for XRP/USD is about to move back in the bearish zone.
Hourly RSI (Relative Strength Index) – The RSI for XRP/USD is currently just near the 50 level, with bearish signs.
Major Support Level – $0.2920
Major Resistance Level – $0.3060