
Reason to trust
How Our News is Made
Strict editorial policy that focuses on accuracy, relevance, and impartiality
Ad discliamer
Morbi pretium leo et nisl aliquam mollis. Quisque arcu lorem, ultricies quis pellentesque nec, ullamcorper eu odio.
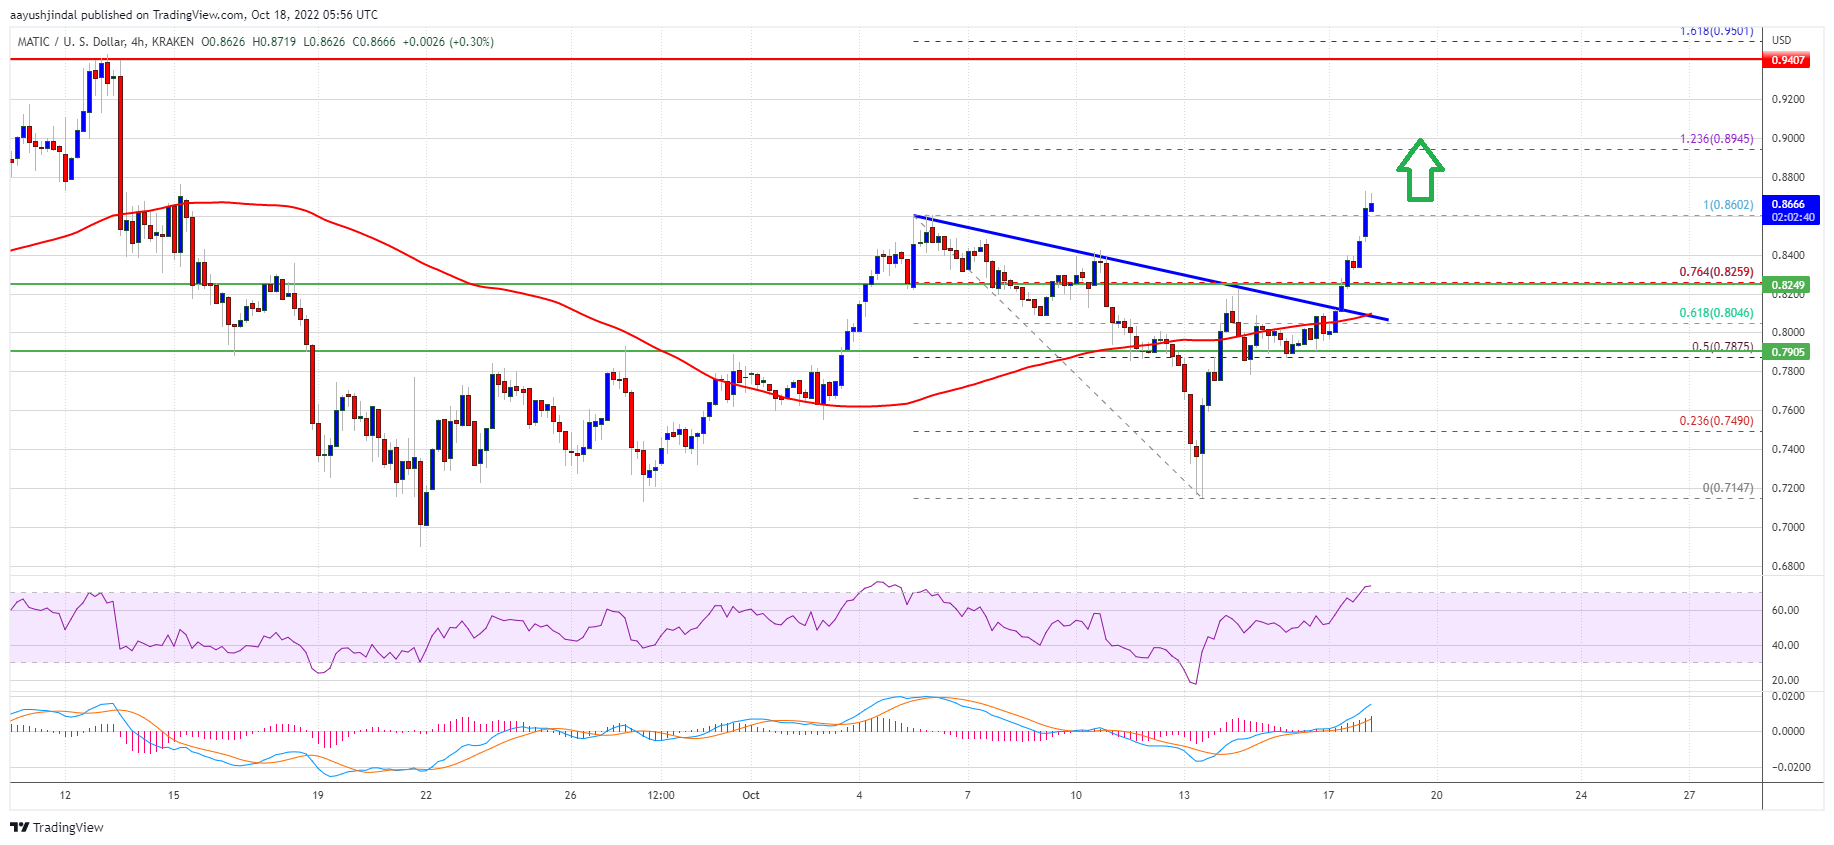
MATIC price started a steady increase from the $0.720 support zone. Polygon buyers might now aim a push towards the key $1.00 resistance.
- MATIC price is gaining pace above the $0.80 level against the US dollar.
- The price is trading well above $0.800 and the 100 simple moving average (4-hours).
- There was a break above a major bearish trend line with resistance at $0.810 on the 4-hours chart of the MATIC/USD pair (data source from Kraken).
- The pair could continue to rise and might soon test the $1.00 resistance zone.
Polygon Price Starts Fresh Increase
After a major decline, polygon’s price found support near the $0.720 zone. MATIC price formed a base above the $0.720 level and started a steady increase.
There was a clear move above the $0.755 and $0.788 resistance levels. The price climbed above the 50% Fib retracement level of the downward move from the $0.8602 swing high to $0.7147 low. There was also a break above a major bearish trend line with resistance at $0.810 on the 4-hours chart of the MATIC/USD pair.
The price is now trading well above $0.800 and the 100 simple moving average (4-hours). It is also showing positive signs above the last swing high at $0.8602, just like bitcoin and ethereum.
On the upside, an immediate resistance is near the $0.895 zone. The first major resistance is forming near the $0.950 zone. It is close to the 1.618 Fib extension level of the downward move from the $0.8602 swing high to $0.7147 low.
Source: MATICUSD on TradingView.com
The main resistance is now forming near the $1.000 level. If there is an upside break above the $0.950 and $1.00 resistance levels, the price could start a strong increase. In the stated case, the price could rise steadily towards the $1.12 level.
Fresh Decline in MATIC?
If MATIC price fails to continue higher above the $0.90 or $0.95 levels, it could start a downside correction. An immediate support on the downside is near the $0.840 level.
The main support is near the $0.800 level and the 100 simple moving average (4-hours). A downside break below the $0.800 level could open the doors for a fresh decline towards $0.750. The next major support is near the $0.720 level.
Technical Indicators
4-hours MACD – The MACD for MATIC/USD is slowly gaining momentum in the bullish zone.
4-hours RSI (Relative Strength Index) – The RSI for MATIC/USD is now above the 50 level.
Major Support Levels – $0.840 and $0.800.
Major Resistance Levels – $0.900, $0.950 and $1.00.