

Popular blockchain network Polkadot (DOT), which links several blockchains, might be riding the winds of change. DOT is showing indications of a possible comeback following a difficult couple of months defined by about 50% price drop from its April peak.
Three main elements combine to create this favourable view: murmurs of a DOT-oriented exchange-traded fund (ETF) on Coinbase, a bullish technical chart pattern, and reasonable market liquidity.
ETF Buzz Ignites Investor Interest
Earlier last week, news surfaced on a social media network showing crypto researcher 0xNoble disclosing Coinbase may be hiding covert DOT ETF intentions. According to the rumours, the bitcoin exchange is in the earliest phases of application for the ETF; the first approval obstacle is expected on July 15th.
Following Coinbase’s major action on June 28th, when they applied for a Spot ETF, a Futures ETF, and a DOT Futures Contract, this news follows.
Coinbase is secretly applying for $DOT ETF 🔥
The first stage of approval is already scheduled for July 15!
Polkadot ETF will be incredibly bullish for the entire ecosystem👇🧵 pic.twitter.com/OF8CrJxp2m
— 0xNobler (@CryptoNobler) July 4, 2024
A DOT ETF has the Polkadot community buzzing with possibility. Traditionally traded funds, which trade like stocks, can bring fresh investors into the bitcoin market.
More general exposure usually translates into more purchasing pressure and maybe higher underlying asset prices. The ETF announcement has especially already spurred a boom in activity on Coinbase Derivatives, evidence of pent-up investor excitement.


Polkadot: Technical Analysis Hints At Price Breakout
Recent technical study by reputable bitcoin research company ZAYK Charts adds gasoline to the DOT rally fire. Their study of DOT’s one-day chart uncovered an intriguing trend sometimes referred to as a declining wedge.
Convergent trendlines that slope downward define this pattern and capture lower highs and lows. Although falling wedges can potentially show a possible positive reversal, historically they were seen as a negative pattern.

ZAYK Charts indicate that the declining wedge indicates sellers’ power is declining even if they have lately been in charge. Polkadot oscillations in this pattern since February provide even more proof. While the higher trendline has operated as resistance, the bottom trendline has constantly given support.
ZAYK expects a break out from this wedge, which usually results in a notable price rise upward. Their breakout goal is about $9.60, thereby offering a possible increase of more than 50% from the present pricing level.
$DOT Still Moving Inside the Falling Wedge,In 1D Timeframe✅
Expecting Breakout📈#DOT #DOTUSDT #Polkadot #Crypto pic.twitter.com/19eQ0cPBwR
— ZAYK Charts (@ZAYKCharts) July 7, 2024
The analyst points out on the chart this target zone as a green box. The timing of this breakout is critical as DOT keeps trading inside the shrinking wedge and pressure rises, increasing the likelihood of a breakout in not too distant future.
Ample Liquidity Could Amplify Potential Surge
The DOT rally story gains even another level of mystery from the existence of notable liquidity. NewsBTC’s heatmap study found up concentrated liquidity zones for DOT between $6.45 and $6.96. Liquidity in relation to an asset is its simplicity of purchase or sale.
Since big buy or sell orders are less likely to create appreciable price fluctuations, high liquidity translates into more consistent price movements.

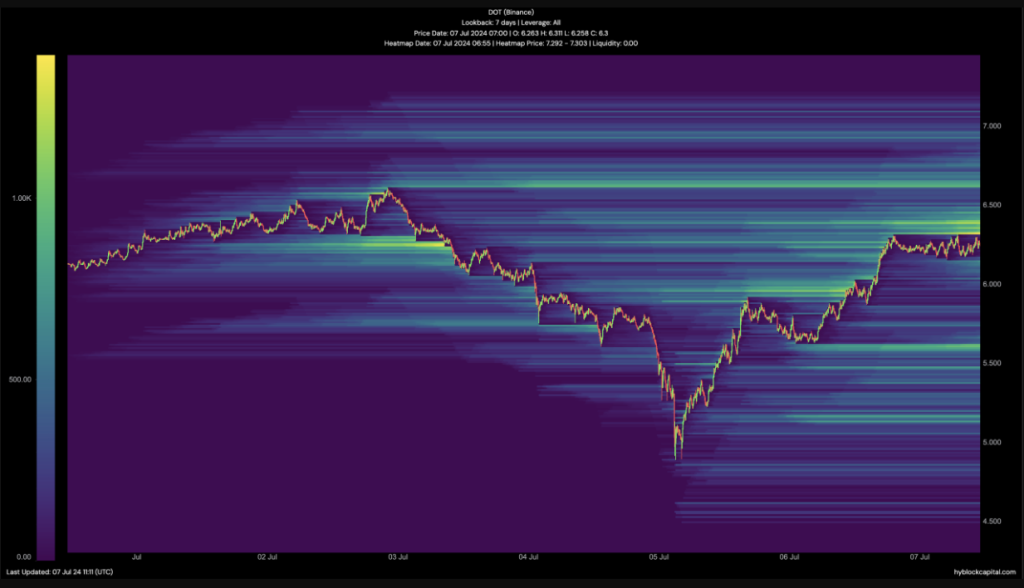
High liquidity between $6.45 and $6.96 makes a possible breakout more likely in the surroundings. This profusion of buy and sell orders can function as a buffer, absorbing selling pressure and thereby averting abrupt pricing declines.
Should a breakout from the declining wedge take place, this liquidity might assist drive DOT’s price towards the $9.60 target zone noted by ZAYK Charts.
Featured image from Shutterstock, chart from TradingView