

Litecoin has faced a massive drop as the entire crypto market experiences intense selling pressure. Increased volatility has driven sharp price swings, with LTC plunging from $130 to $100 in a matter of hours. This steep decline has raised concerns among investors as Litecoin struggles to maintain key support levels.
Market uncertainty has left Litecoin trading at a crucial level, with bulls trying to defend $100 amid persistent selling pressure. The failure to hold above higher price ranges suggests a weakened bullish structure, increasing the risk of further declines.
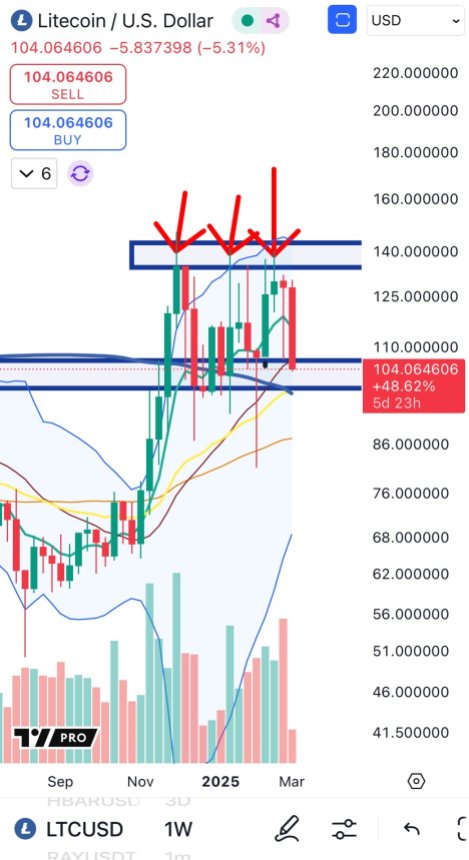
Top analyst BigCheds shared a technical analysis highlighting that this is the third time Litecoin has thrown back to the $100 level. Historically, repeated retests of key support zones increase the likelihood of a breakdown, adding to the bearish sentiment surrounding LTC. If the $100 level fails to hold, Litecoin could face a deeper correction, aligning with the broader market downturn.
Traders are now closely watching Litecoin’s next move to determine whether it can stabilize or if another wave of selling will push it lower. With volatility dominating the market, LTC remains at a pivotal moment that could dictate its price action in the coming weeks.
Litecoin Keeps Holding The Range
Litecoin is currently trading between key liquidity levels after months of volatility and uncertainty in the market. Despite its turbulent price action, LTC has shown relative strength in recent weeks, managing to hold key support levels. However, it continues to struggle against significant resistance, preventing a clear trend from forming.
The main issue facing Litecoin is its inability to break above supply levels, keeping price action in a tight range. While bulls have attempted to push LTC higher, sellers at major resistance levels have repeatedly stalled momentum. Without a decisive breakout, Litecoin remains stuck in a consolidation phase, leaving traders unsure of its next move.
BigCheds’ technical analysis highlighted that another high-timeframe (HTF) throwback to the $100 range followed a $130 supply level rejection. This marks the third time Litecoin has tested the $100 support zone, a level that has been crucial in preventing deeper declines. If LTC fails to hold this area, it could trigger a more extended correction.

A breakout above $130 or a breakdown below $100 will likely determine Litecoin’s next major move. Until then, traders remain cautious as price action continues to signal uncertainty and indecision. The coming days will be critical in deciding whether LTC can reclaim higher levels or face another wave of selling pressure.
Price Action Details: Key Levels To Hold
Litecoin is currently trading at $102 after a massive drop from the $130 mark, leaving bulls in a critical position to defend key levels. The recent decline has pushed LTC to the lower boundary of its trading range, testing crucial support that has held multiple times in recent months.

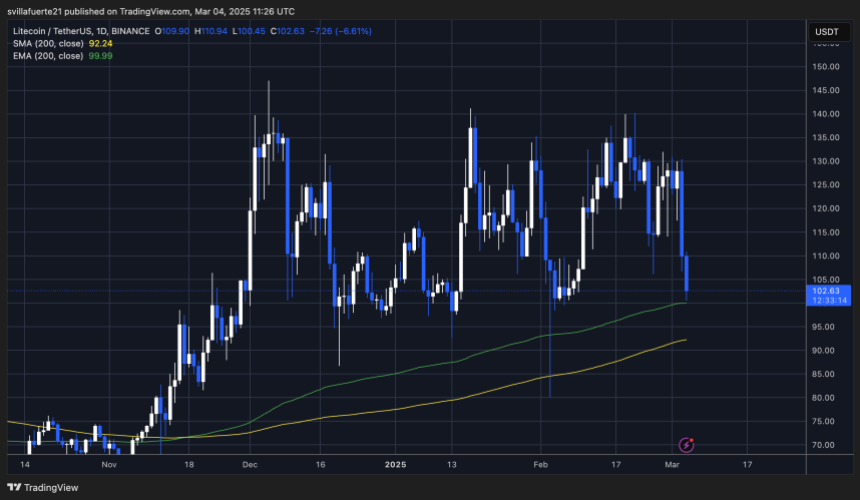
So far, price action has respected both supply and demand zones, with resistance around $130-$140 and support near $100. This channel structure has defined Litecoin’s movement, keeping it within a clear range-bound pattern. Bulls must now hold the current level to sustain this channel thesis, preventing further downside.
eIf Litecoin confirms a breakout above $130, it could signal the start of a new bullish trend, pushing LTC toward higher levels. However, a break below $100 would indicate a loss of demand, likely triggering a deeper correction and increasing selling pressure.
For now, traders are closely watching whether LTC will hold or break its current support zone. The next major move will likely come from a decisive breakout in either direction, setting the stage for Litecoin’s trend in the coming weeks.
Featured image from Dall-E, chart from TradingView