On-chain data shows a Litecoin indicator is currently showing a pattern that has historically been bearish for the cryptocurrency’s price.
Litecoin 30-Day MVRV Ratio Has Registered A Surge Recently
As pointed out by an analyst on Twitter, the 30-day MVRV ratio has spiked towards the 35% mark recently. The “Market Value to Realized Value (MVRV) ratio” here refers to an indicator that measures the ratio between the Litecoin market cap and its realized cap.
The “realized cap” here is a capitalization model that aims to find a sort of true value for the asset. According to this model, the true value of any coin in circulation is not the current spot price, but the price at which it was last moved/transferred on the blockchain.
As the MVRV compares the market cap (that is, the spot price) with the realized cap (the “real” value of the asset), it can tell us whether the current price is overinflated or not.
When the value of the MVRV is greater than 1, it means that the market cap is larger than the realized cap currently. Naturally, such a trend can imply the asset may be overpriced right now.
On the other hand, values of the indicator below this threshold suggest the cryptocurrency could be undervalued at the moment as its realized cap is higher than the market cap.
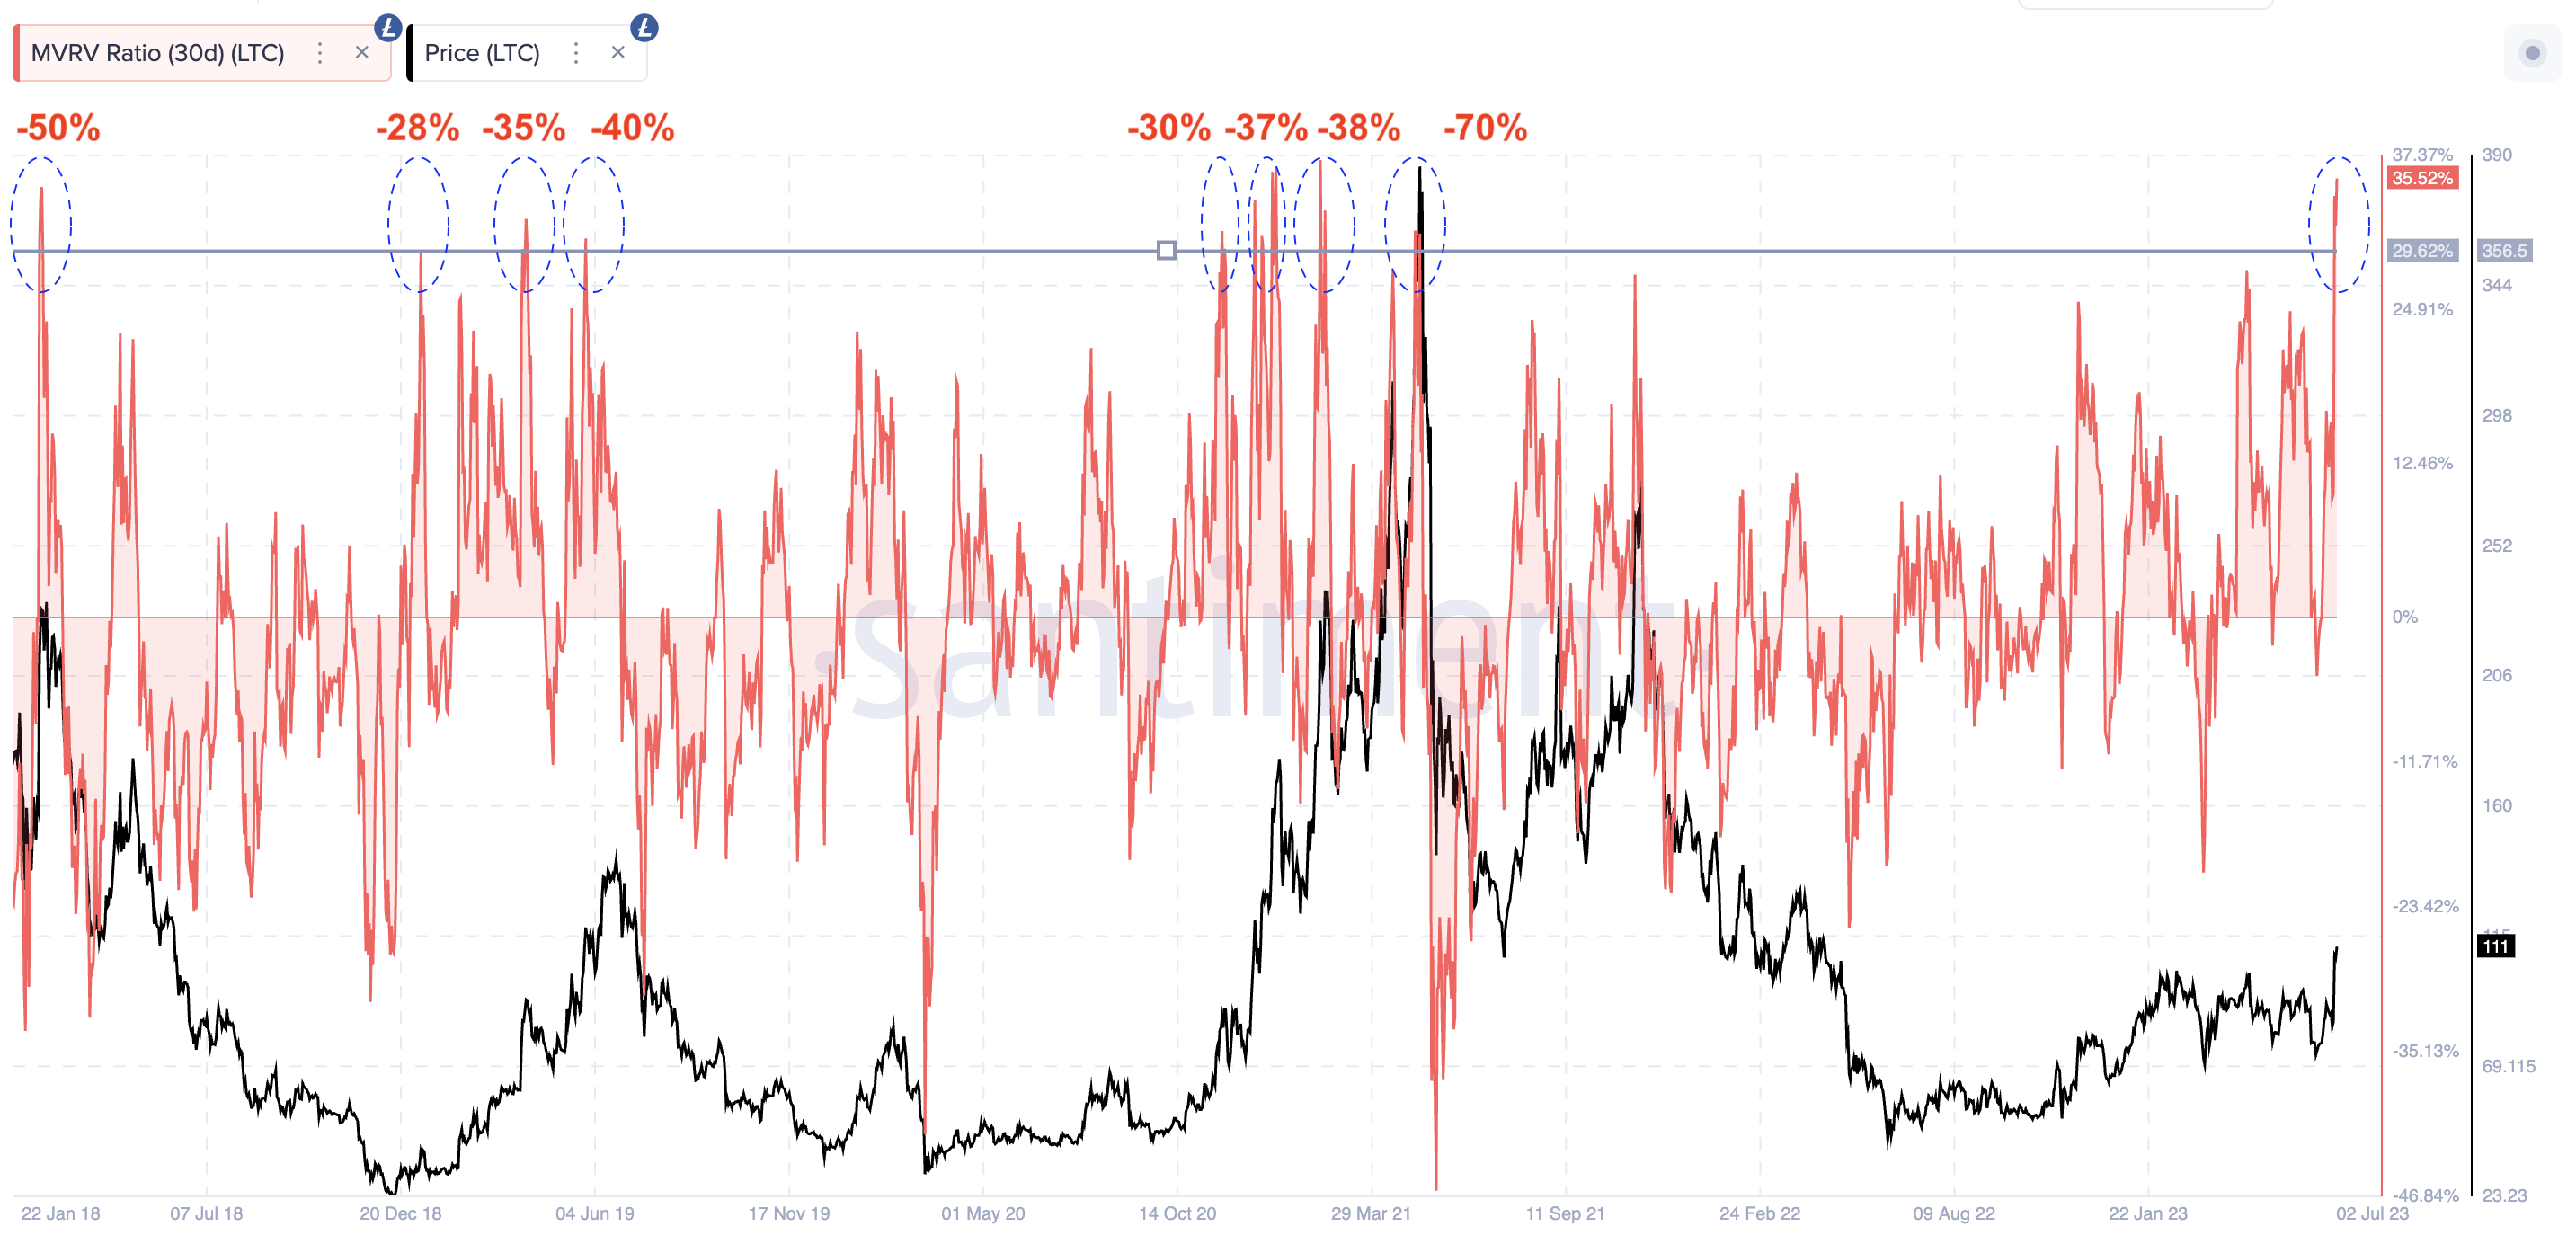
Now, here is a chart that shows the trend in the 30-day Litecoin MVRV ratio over the last few years:
Looks like the 30-day value of the metric has observed a sharp increase in recent days | Source: Ali on Twitter
Here, the MVRV ratio is displayed in terms of the percentage difference between the market cap and the realized cap (meaning that the 0% line plays the role of the 1 mark in this version of the indicator).
As shown in the above graph, the 30-day Litecoin MVRV ratio has registered some rapid growth recently. This jump in the indicator has come as the latest rally in the cryptocurrency has occurred, which has now taken the price above the $110 level.
The metric has now hit a value of 35%, which implies that the market cap is currently 35% more than the realized cap. Historically, the indicator’s value rising above the 30% level has been a sign that the asset is becoming notably overpriced.
From the chart, it’s visible that the cryptocurrency’s price has generally always registered a correction whenever this pattern in the 30-day MVRV ratio has formed. The degree of this price drop has varied, but on average it has been around 30% to 40%.
It now remains to be seen if this historical pattern would continue to hold true this time as well. Naturally, if it does hold, then Litecoin would register a significant drop in the coming days.
LTC Price
At the time of writing, Litecoin is trading around $109, up 23% in the last week.
LTC has seen some rapid uptrend recently | Source: LTCUSD on TradingView


