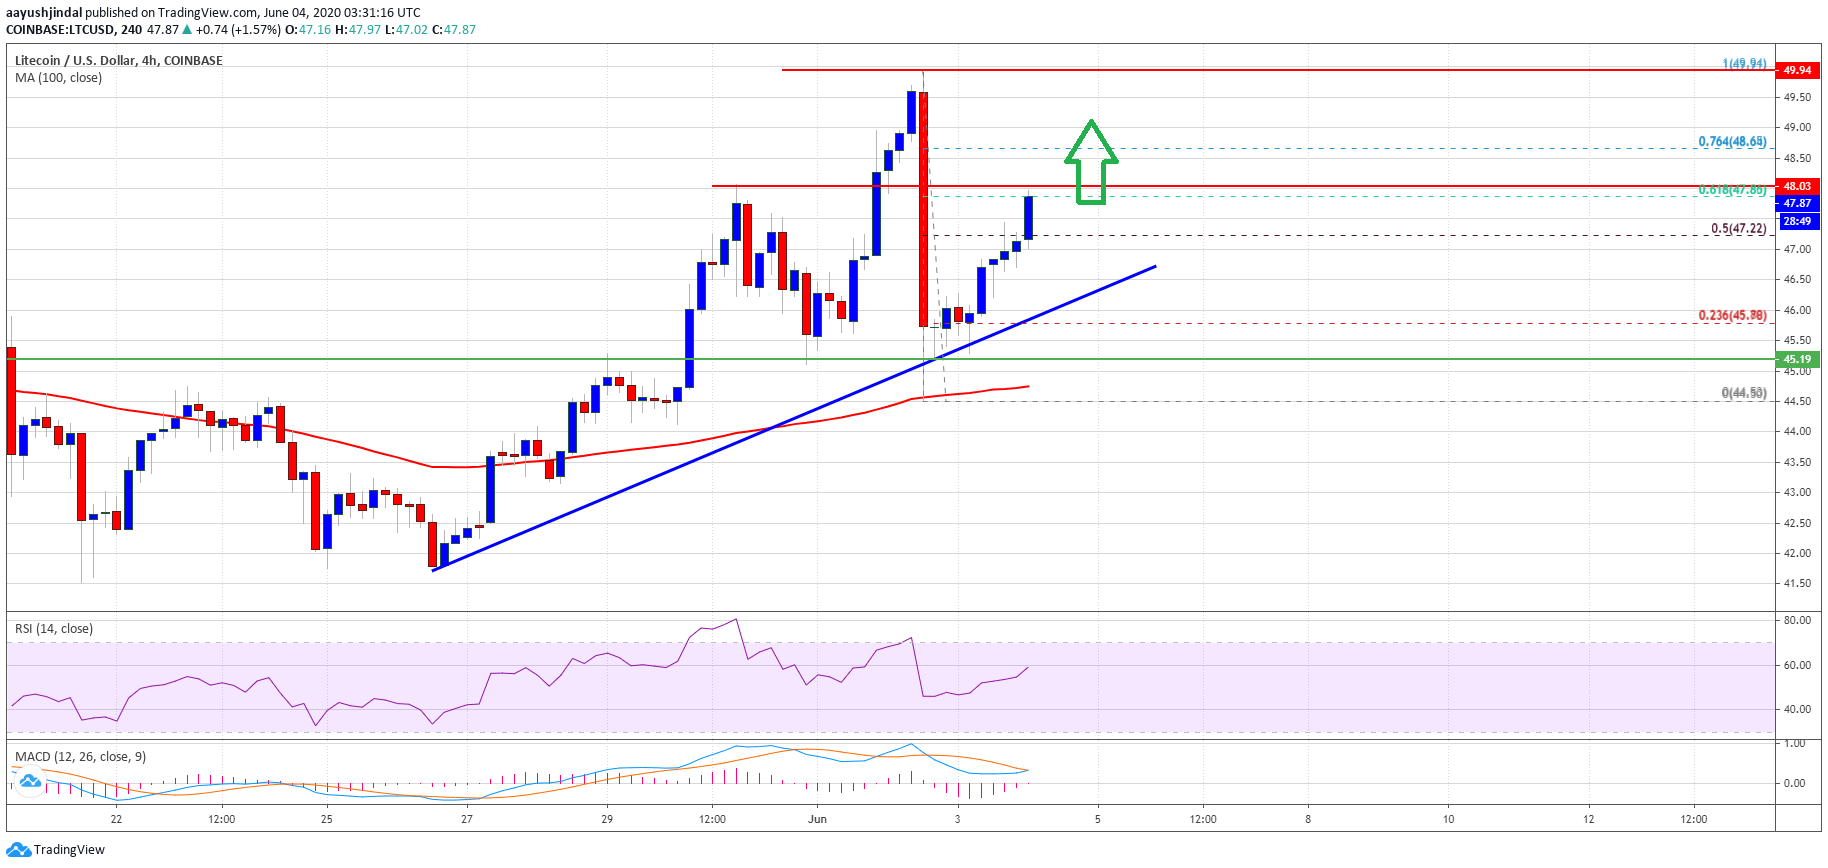
- Litecoin retreated from the $50.00 resistance and found support near $45.00 against the US Dollar.
- The price is currently rising and it could surge if it clears the $48.00 resistance.
- There is a major bullish trend line forming with support near $46.50 on the 4-hours chart of the LTC/USD pair (data feed from Kraken).
- Bitcoin price could also continue higher above $9,800 if LTC first clears the $48.00 resistance.
Litecoin price is rising again from the $45.00 support zone against the US Dollar. LTC is likely to first break higher and it might fuel a fresh increase in bitcoin and ETH.
Litecoin Price Could Retest $50
Earlier this week, litecoin price climbed higher above the $45.00 and $48.00 resistance levels against the US Dollar. However, LTC price failed to clear the $50.00 resistance area.
A high was formed near $49.94 before the price started a sharp downside correction. It broke a few important supports near $48.00, but it remained well bid above the 100 simple moving average (4-hours).
A low is formed near $44.58 and the price is currently rising. Litecoin is trading nicely above the $46.50 level. It surpassed the 50% Fib retracement level of the recent decline from the $49.94 high to $44.58 low.
There is also a major bullish trend line forming with support near $46.50 on the 4-hours chart of the LTC/USD pair. The pair is now approaching a major resistance near the $48.00 level (the recent breakdown zone). It coincides with the 61.8% Fib retracement level of the recent decline from the $49.94 high to $44.58 low.

A successful break above the $48.00 resistance could spark a fresh run towards the $50.00 resistance. The next major hurdle for the bulls is near the $52.50 level. In the mentioned case, bitcoin could also gain traction above the $9,740 and $9,800 resistance levels.
Fresh Decrease in LTC
If litecoin fails to continue above the $48.00 resistance, there is a risk of a fresh decline. On the downside, the first major support is near the trend line and $46.50.
The main support is still near the $45.00 level. A daily close below the $45.00 level could initiate a fresh decline towards the $41.50 support.
Technical indicators:
4-hours MACD – The MACD is about to move back into the bullish zone.
4-hours RSI (Relative Strength Index) – The RSI for LTC/USD is currently well above the 50 level.
Major Support Levels – $46.50 followed by $45.00.
Major Resistance Levels – $48.00 and $50.00.
Take advantage of the trading opportunities with Plus500
Risk disclaimer: 76.4% of retail CFD accounts lose money.


