
Reason to trust
How Our News is Made
Strict editorial policy that focuses on accuracy, relevance, and impartiality
Ad discliamer
Morbi pretium leo et nisl aliquam mollis. Quisque arcu lorem, ultricies quis pellentesque nec, ullamcorper eu odio.
Ethereum price started a downside correction below $1,950 against the US Dollar. ETH is testing the $1,900 support and is showing a few bearish signs.
- Ethereum is correcting gains below the $1,950 zone.
- The price is trading below $1,940 and the 100-hourly Simple Moving Average.
- There is a key bearish trend line forming with resistance near $1,925 on the hourly chart of ETH/USD (data feed via Kraken).
- The pair could start another increase unless there is a close below $1,900 in the near term.
Ethereum Price Corrects Gains
Ethereum’s price failed to clear the $1,975 resistance and started a downside correction. ETH traded below the $1,950 level and extended its decline, similar to Bitcoin.
There was a move below the $1,920 support. Finally, the price spiked below $1,900. A low is formed near $1,894 and the price is now consolidating losses. It is now trading near the 23.6% Fib retracement level of the recent decline from the $1,974 swing high to the $1,894 low.
Ether is trading below $1,940 and the 100-hourly Simple Moving Average. There is also a key bearish trend line forming with resistance near $1,925 on the hourly chart of ETH/USD.
Immediate resistance is near the $1,925 level the 100-hourly Simple Moving Average. The next major resistance is near the $1,945 level. It is close to the 61.8% Fib retracement level of the recent decline from the $1,974 swing high to the $1,894 low.
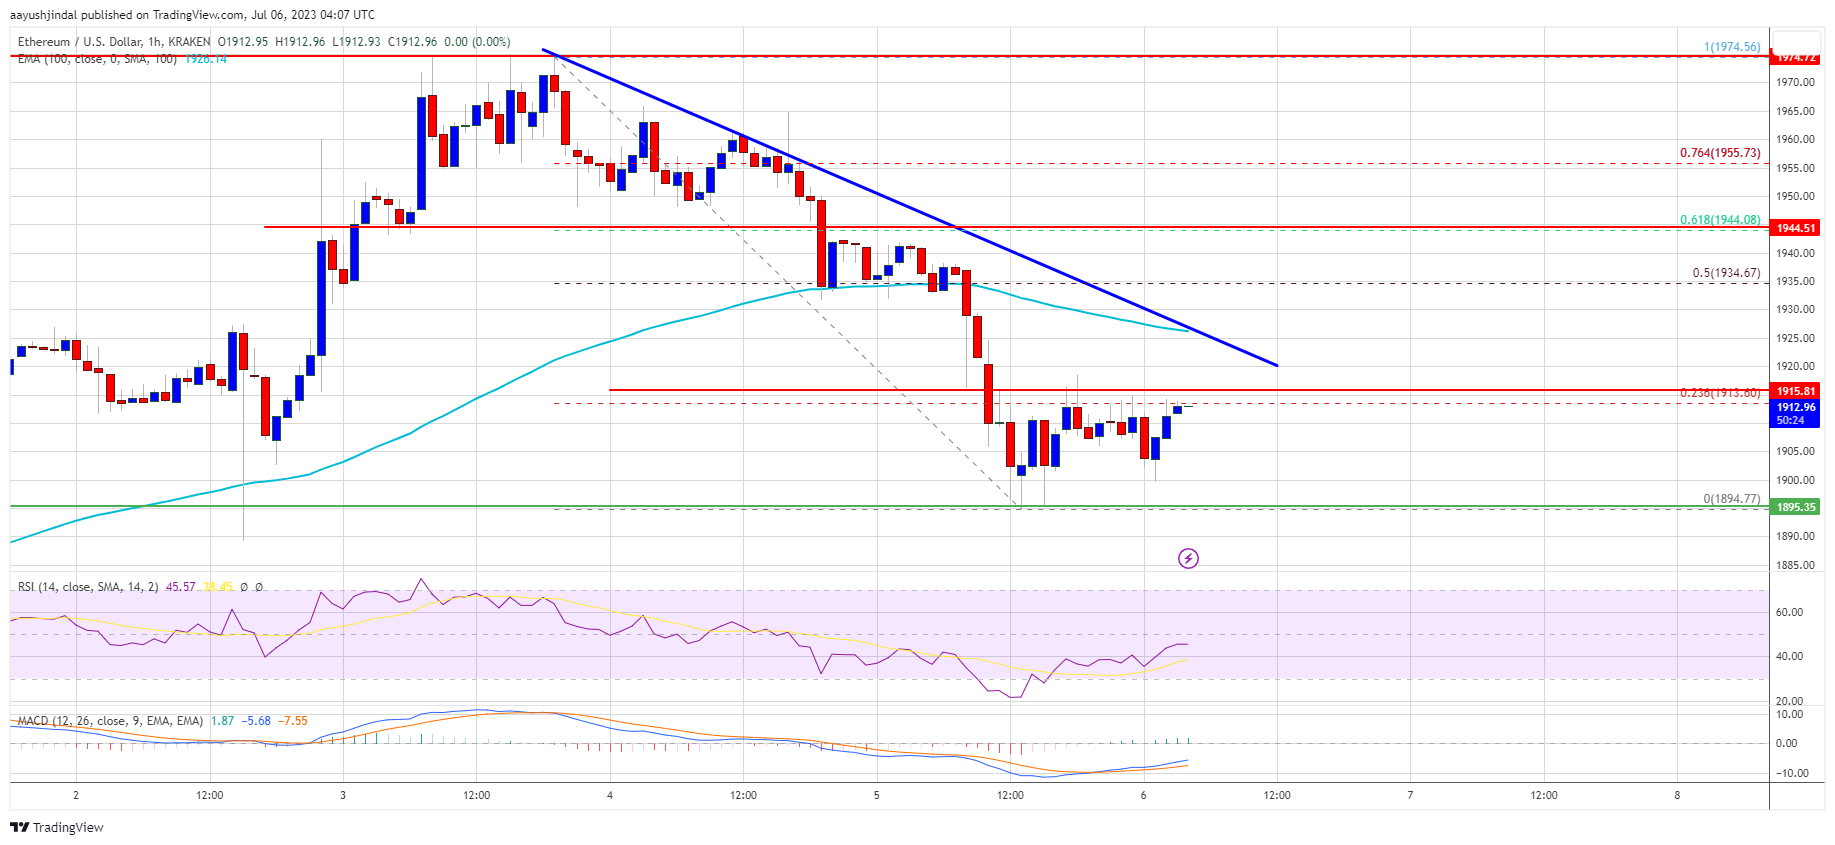
Source: ETHUSD on TradingView.com
A clear move above the $1,945 resistance could push the price toward $1,975. The main resistance is still near the $2,000 level, above which the price could start a decent increase. The next major resistance is near the $2,120 level. Any more gains could send Ether toward the $2,200 resistance.
More Losses in ETH?
If Ethereum fails to clear the $1,925 resistance or $1,945, it could continue to move down. Initial support on the downside is near the $1,900 level.
The first major support is near the $1,870 level. The next major support is near the $1,820 level. If there is a move below the $1,820 support, the price could drop toward the $1,770 support level.
Technical Indicators
Hourly MACD – The MACD for ETH/USD is losing momentum in the bearish zone.
Hourly RSI – The RSI for ETH/USD is now below the 50 level.
Major Support Level – $1,900
Major Resistance Level – $1,945


