
Reason to trust
How Our News is Made
Strict editorial policy that focuses on accuracy, relevance, and impartiality
Ad discliamer
Morbi pretium leo et nisl aliquam mollis. Quisque arcu lorem, ultricies quis pellentesque nec, ullamcorper eu odio.
Ethereum price started a decent increase after Bitcoin gained momentum against the US dollar. ETH is rising and might test the key $1,750 resistance.
- Ethereum started a decent increase above the $1,650 resistance.
- The price is trading above $1,660 and the 100-hourly Simple Moving Average.
- There is a key bullish trend line forming with support near $1,645 on the hourly chart of ETH/USD (data feed via Kraken).
- The pair could climb further higher, but it might face strong resistance near $1,750.
Ethereum Price Reclaims $1,650
Ethereum stayed above the $1,550 support zone. The recent pump in Bitcoin above the $28,500 resistance sparked bullish moves in ETH. There was a steady increase above the $1,600 and $1,620 resistance levels.
The price even cleared the key $1,650 resistance zone. A high is formed near $1,700 and the price is now consolidating gains. It is trading well above the 23.6% Fib retracement level of the upward move from the $1,620 swing low to the $1,700 high.
Ethereum is now trading above $1,660 and the 100-hourly Simple Moving Average. There is also a key bullish trend line forming with support near $1,645 on the hourly chart of ETH/USD. The trend line is near the 61.8% Fib retracement level of the upward move from the $1,620 swing low to the $1,700 high.
On the upside, the price is facing resistance near the $1,700 level. The first major resistance is near the $1,720 zone. The next key resistance is $1,750, where the bears might emerge. To continue higher, the price must settle above the $1,750 resistance.
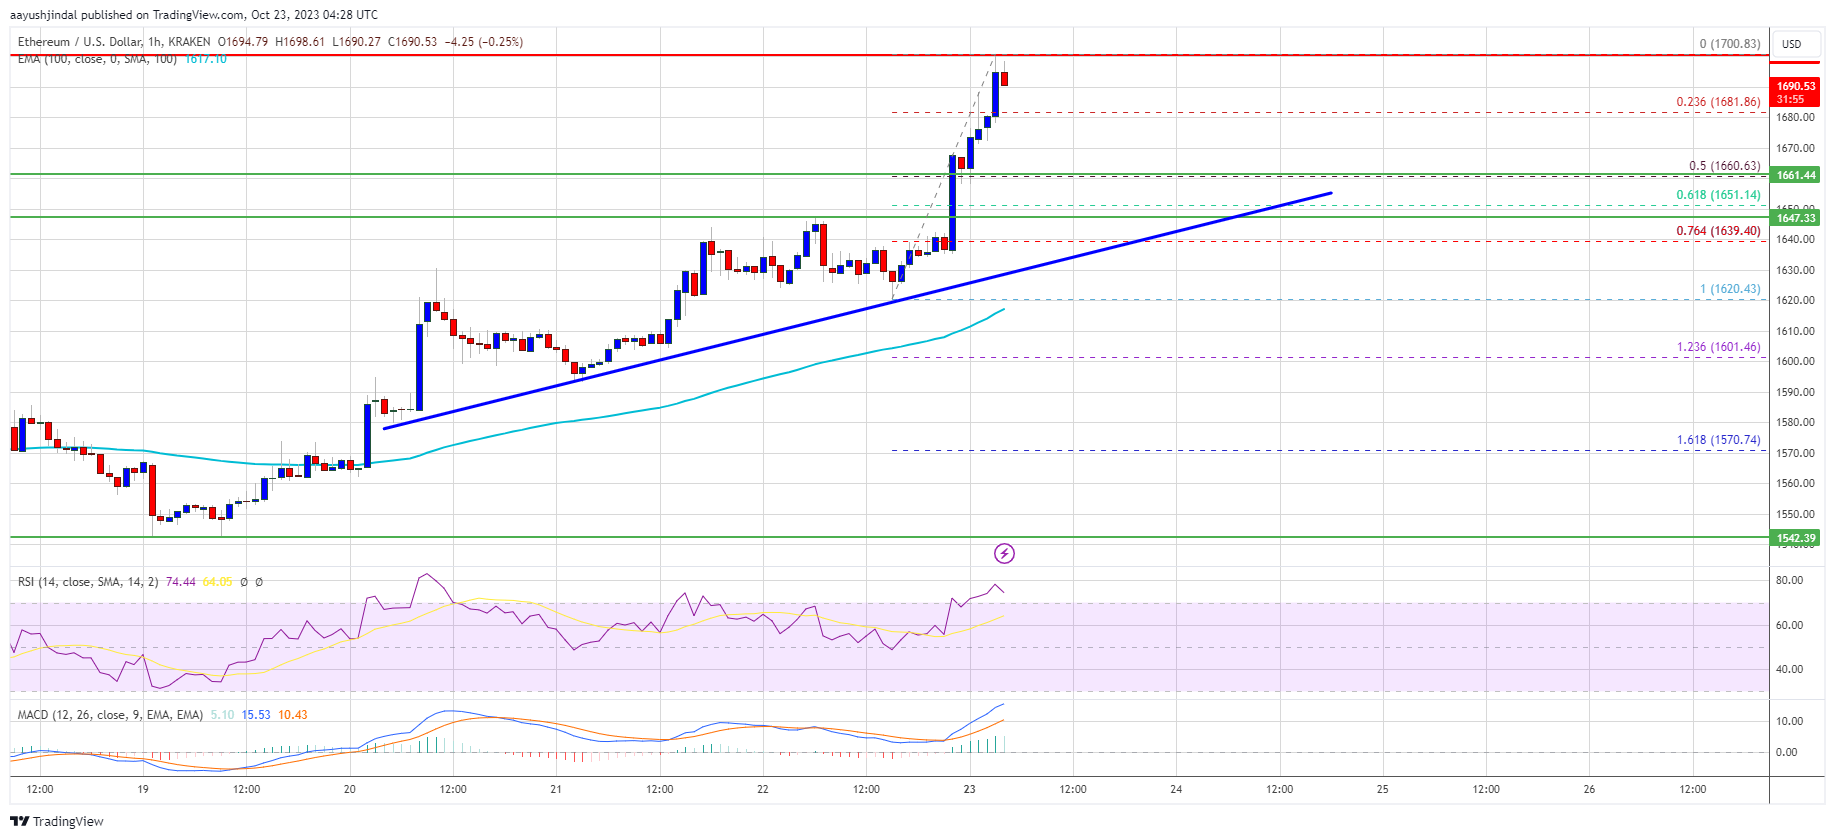
Source: ETHUSD on TradingView.com
In the stated case, Ether could start a strong increase toward the $1,880 resistance. Any more gains might open the doors for a move toward $2,000.
Downside Correction in ETH?
If Ethereum fails to clear the $1,700 resistance, it could start a downside correction. Initial support on the downside is near the $1,660 level.
The next key support is $1,645 and the trend line zone. A downside break below the $1,645 support might send the price further lower. In the stated case, the price could drop toward the $1,620 level and the 100-hourly Simple Moving Average. Any more losses may perhaps send Ether toward the $1,550 level.
Technical Indicators
Hourly MACD – The MACD for ETH/USD is gaining momentum in the bullish zone.
Hourly RSI – The RSI for ETH/USD is now above the 50 level.
Major Support Level – $1,645
Major Resistance Level – $1,700