
Reason to trust
How Our News is Made
Strict editorial policy that focuses on accuracy, relevance, and impartiality
Ad discliamer
Morbi pretium leo et nisl aliquam mollis. Quisque arcu lorem, ultricies quis pellentesque nec, ullamcorper eu odio.
Ethereum is retreating lower from the $245 resistance against the US Dollar. ETH is now showing bearish signs below $235, but the $230 support holds the key in the near term.
- Ethereum is currently facing an increase in selling pressure below $240 and $235.
- The price tested the $230 support level and it is currently correcting higher.
- There is a crucial bearish trend line forming with resistance near $235 on the hourly chart of ETH/USD (data feed via Kraken).
- The pair could continue to move down if it fails to recover above $235 and $238.
Ethereum Price Turns Red
In the past few sessions, Ethereum followed a bearish path from the $245 resistance against the US Dollar. ETH price broke the main $235 support level and the 100 hourly simple moving average to move into a bearish zone.
The decline was such that the price tested the $230 support level. Ether is currently correcting higher and trading above the $232 level. It surpassed the 23.6% Fib retracement level of the recent decline from the $239 swing high to $230 low.
On the upside, the price is facing a strong resistance near the $235 level. There is also a crucial bearish trend line forming with resistance near $235 on the hourly chart of ETH/USD.
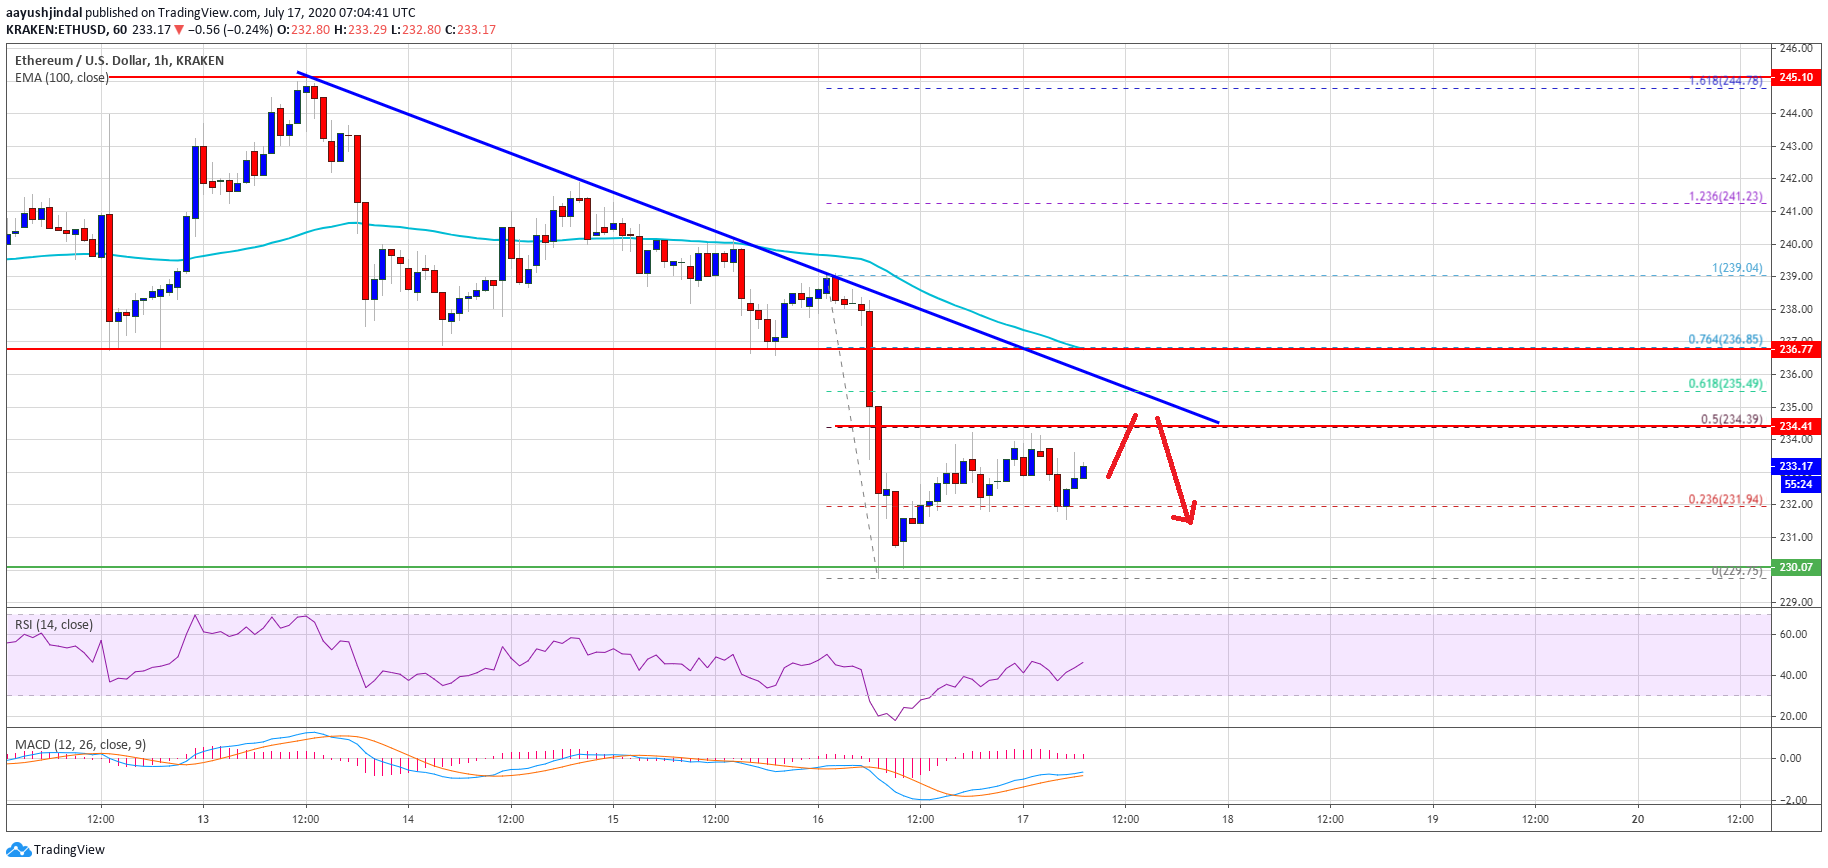
Ethereum price trades below $235. Source: TradingView.com
The trend line is close to the 50% % Fib retracement level of the recent decline from the $239 swing high to $230 low. The next key resistance is near the $236 level and the 100 hourly SMA (the recent breakdown zone).
If ether climbs above the $235 and $236 resistance levels, it could start a decent recovery wave. The next hurdle could be $240, but the main barrier for the bulls is still near the $245 level.
More Losses in ETH?
On the downside, the $230 support holds the key in the coming sessions. If there is a successful break and close below the $230 support, it might confirm a bearish break.
In the stated case, the bears are likely to take control and they might aim a test of the $220 pivot level.
Technical Indicators
Hourly MACD – The MACD for ETH/USD is slowly moving in the bullish zone.
Hourly RSI – The RSI for ETH/USD is currently rising towards the 50 level.
Major Support Level – $230
Major Resistance Level – $236
Take advantage of the trading opportunities with Plus500
Risk disclaimer: 76.4% of retail CFD accounts lose money.