Reason to trust
How Our News is Made
Strict editorial policy that focuses on accuracy, relevance, and impartiality
Ad discliamer
Morbi pretium leo et nisl aliquam mollis. Quisque arcu lorem, ultricies quis pellentesque nec, ullamcorper eu odio.
Ethereum started a strong recovery wave above the $350 resistance against the US Dollar. ETH price is up over 10%, but it must still break the $370 resistance for upside continuation.
- Ethereum gaining traction above the $340 and $350 resistance levels.
- The price is now well above the 100 hourly simple moving average, but it is facing hurdles near $370.
- There was a break above a major bearish trend line with resistance near $340 on the hourly chart of ETH/USD (data feed via Kraken).
- The pair must surpass the $370 resistance for upside continuation in the near term.
Ethereum Price Rally Reaches Inflection Zone
After forming a support base above $330, Ethereum started a strong recovery wave. ETH price broke the $340 and $350 resistance levels to move into a positive zone.
There was a close above the $350 resistance and the 100 hourly simple moving average. The upward move gained pace after there was a break above a major bearish trend line with resistance near $340 on the hourly chart of ETH/USD.
The pair traded above the 50% Fib retracement level of the downward move from the $401 high to $310 swing low. Ether price is now testing another major resistance near the $370 level (the last breakdown zone).
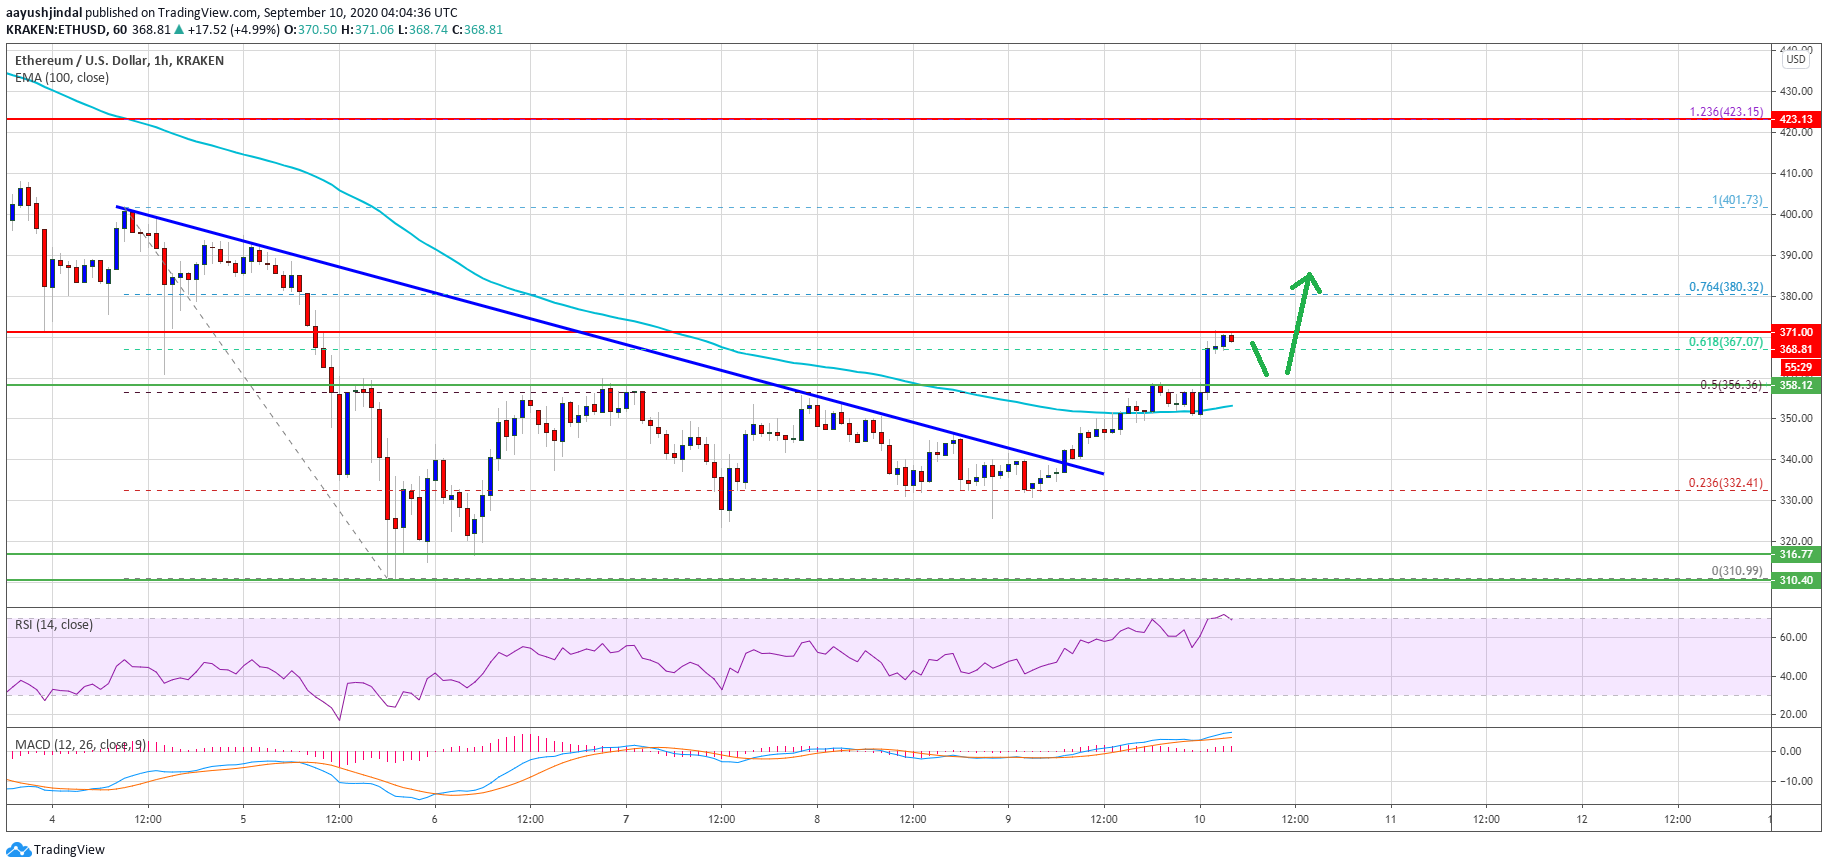
Ethereum price trades above $360. Source: TradingView.com
The next key resistance is near the $380 level. It is close to the 76.4% Fib retracement level of the downward move from the $401 high to $310 swing low. A successful close above the $370 and $380 resistance levels may perhaps open the doors for a decent increase.
The next major resistance is near the $395 and $400 levels, above which the price is likely to rise steadily towards the $430 resistance zone.
Downside Correction in ETH?
If Ethereum fails to clear the $370 resistance or the $380 technical hurdles, there could be a short-term downside correction. An initial support on the downside is near the $360 level.
The next major support is near the $350 level and the 100 hourly simple moving average. If ether fails to stay above the $350 support, the price is likely to resume its decline. In the stated case, the bears might aim a retest of the $330 support.
Technical Indicators
Hourly MACD – The MACD for ETH/USD is slowly gaining pace in the bullish zone.
Hourly RSI – The RSI for ETH/USD is currently near the 70 level.
Major Support Level – $350
Major Resistance Level – $370