
Reason to trust
How Our News is Made
Strict editorial policy that focuses on accuracy, relevance, and impartiality
Ad discliamer
Morbi pretium leo et nisl aliquam mollis. Quisque arcu lorem, ultricies quis pellentesque nec, ullamcorper eu odio.
- ETH price is currently trimming gains from the $158 resistance area against the US Dollar.
- The price is now approaching a couple of important supports near the $144 area.
- Earlier, there was a break above a major bearish trend line with resistance near $152 on the 4-hours chart of ETH/USD (data feed via Kraken).
- The pair is likely to bounce back as long as it is above the $142 support area.
Ethereum price is approaching a crucial support area against the US Dollar, similar to bitcoin. ETH price must hold the $142 support to climb towards $160.
Ethereum Price Weekly Analysis
This past week, Ethereum started a solid recovery above the $142 resistance area against the US Dollar. Furthermore, ETH price surpassed a major resistance area near the $150 level.
More importantly, there was a break above a major bearish trend line with resistance near $152 on the 4-hours chart of ETH/USD. Besides, the pair surpassed the $155 resistance area, but it struggled to gain momentum above $158.
A swing high was formed near $158 and the price remained well below the 100 simple moving average (4-hours). Ethereum is currently correcting lower below the 23.6% Fib retracement level of the upward move from the $131 swing low to $158 high.
The price is now approaching the broken trend line and the $145 support area. Additionally, the 50% Fib retracement level of the upward move from the $131 swing low to $158 high is near the $145 level.
The main support is near the $142 area. It is near the 61.8% Fib retracement level of the upward move from the $131 swing low to $158 high. Therefore, a downside break below the $142 support area could reduce chances of another upward move in the near term.
In the mentioned scenario, the price is likely to revisit the $134 and $132 support levels. On the upside, the first key resistance is near the $152 level. The key resistance area is near the $158 and $160 levels.
Thus, a clear break above the $160 level and the 100 simple moving average (4-hours) may perhaps push the price back into a positive zone.
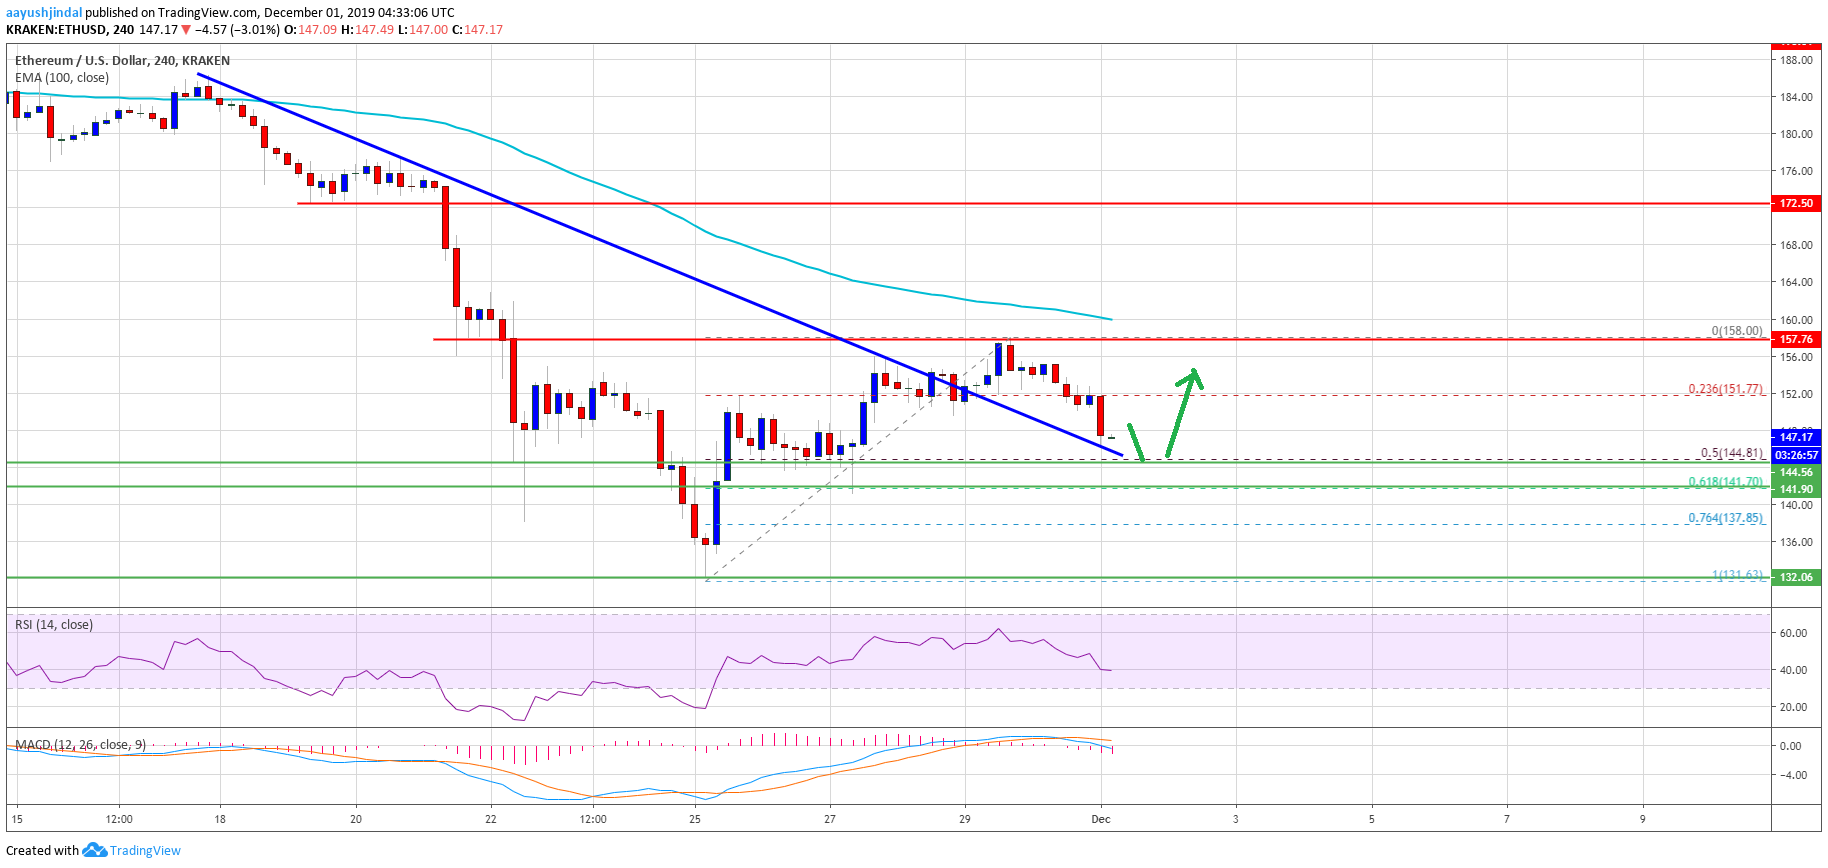
The above chart indicates that Ethereum price is clearly approaching a couple of important supports near $145 and $142. As long as the price is above $142, it could bounce back. If not, the bears are likely to aim $132 or $125.
Technical Indicators
4 hours MACD – The MACD for ETH/USD is currently gaining strength in the bullish zone.
4 hours RSI – The RSI for ETH/USD is currently declining and it is near the 40 level.
Major Support Level – $142
Major Resistance Level – $160