
Reason to trust
How Our News is Made
Strict editorial policy that focuses on accuracy, relevance, and impartiality
Ad discliamer
Morbi pretium leo et nisl aliquam mollis. Quisque arcu lorem, ultricies quis pellentesque nec, ullamcorper eu odio.
- ETH price formed a solid support at $100 and started a strong uptrend against the US Dollar.
- There was a break above a crucial bearish trend line with resistance at $104 on the 4-hours chart of ETH/USD (data feed via Kraken).
- The pair traded as high as $122 and it is currently consolidating gains with range moves.
Ethereum price climbed higher sharply versus the US Dollar and Bitcoin. ETH/USD is now placed in a bullish zone above the $114 and $112 support levels in the near term.
Ethereum Price Analysis
This past week, we saw a fresh drop in ETH price towards the $102 and $100 support levels against the US Dollar. The ETH/USD pair found a strong buying interest near the $100 level and later started a strong upward move. It broke many resistances such as $104, $107, $112, $114 and $116. More importantly, there was a close above the $112 barrier and the 100 simple moving average (4-hours). It seems like a double bottom pattern was formed at $100, resulting in a bullish break above $110.
Moreover, there was a break above a crucial bearish trend line with resistance at $104 on the 4-hours chart of ETH/USD. The pair traded towards the $125 level and formed a high near $122. Later, the price started consolidating gains below the $120 level. It tested the 23.6% Fib retracement level of the last wave from the $100 low to $122 high. The current price action is positive above the $116 level. If there is a downside extension, the price may test $114 and the 100 simple moving average (4-hours). Besides, the 50% Fib retracement level of the last wave from the $100 low to $122 high is also near $111 level to act as a strong support.
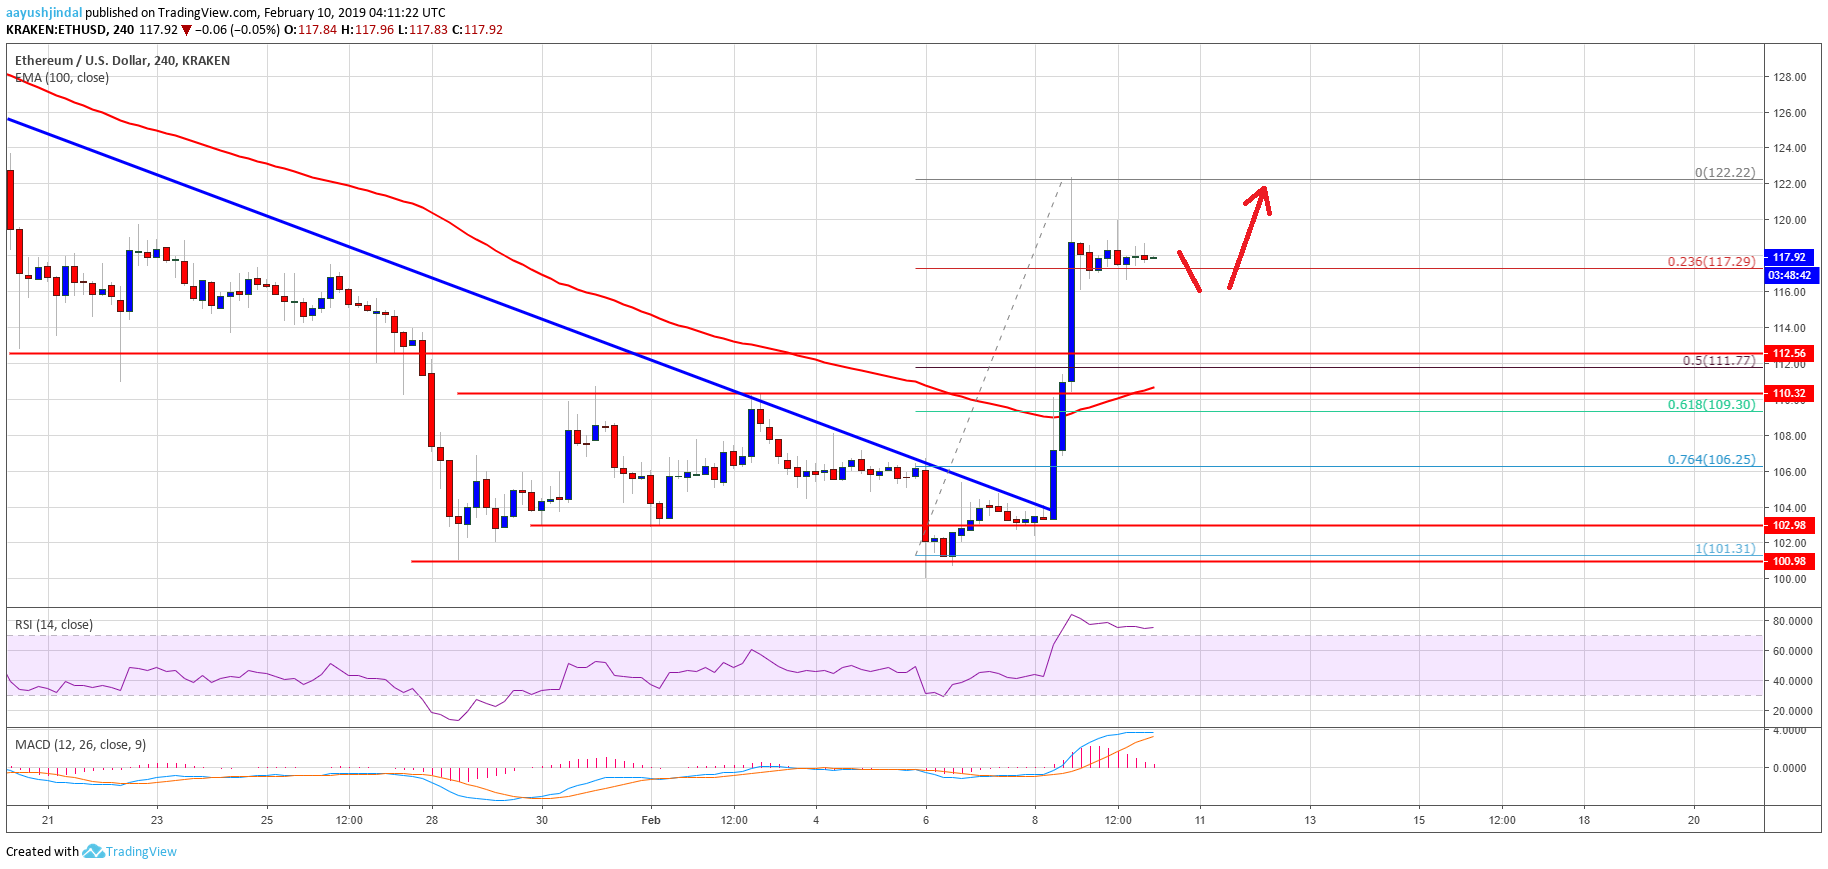
The above chart indicates that ETH price is now placed nicely in a bullish zone above the $114 and $112 support levels. On the upside, the key resistances are $124, $125 and $132.
Technical Indicators
4-hours MACD – The MACD for ETH/USD is slowly reducing its bullish slope.
4-hours RSI – The RSI for ETH/USD is currently well above the 60 level.
Major Support Level – $114
Major Resistance Level – $124


