Reason to trust
How Our News is Made
Strict editorial policy that focuses on accuracy, relevance, and impartiality
Ad discliamer
Morbi pretium leo et nisl aliquam mollis. Quisque arcu lorem, ultricies quis pellentesque nec, ullamcorper eu odio.
Key Highlights
- ETH price faced a lot of selling pressure recently and declined below $810 against the US Dollar.
- Yesterday’s highlighted major bearish trend line with current resistance at $820 is intact on the hourly chart of ETH/USD (data feed via SimpleFX).
- The pair may correct a few points in the short term, but it remains in a downtrend below $840.
Ethereum price extended losses against the US Dollar and Bitcoin. ETH/USD declined as low as $776 and it is currently correcting higher toward barriers.
Ethereum Price Resistance
There was no major upside move in ETH price above the $860 level against the US Dollar. The price struggled to correct higher and it started a downside move below the $840 level. It declined and broke a couple of support levels such as $810 and $800. It traded as low as $776 from where a minor upside correction was initiated. However, the price may face many barriers on the upside on the way to $810.
It has moved above the 23.6% Fib retracement level of the last decline from the $858 high to $776 low. However, there is a major resistance near $810-820. More importantly, yesterday’s highlighted major bearish trend line with current resistance at $820 is intact on the hourly chart of ETH/USD. The trend line resistance is close to the 50% Fib retracement level of the last decline from the $858 high to $776 low. Therefore, if the price corrects further from the current levels, it could face sellers near the $820 and $825 levels. Above $825, the next major barrier for buyers is at $840.
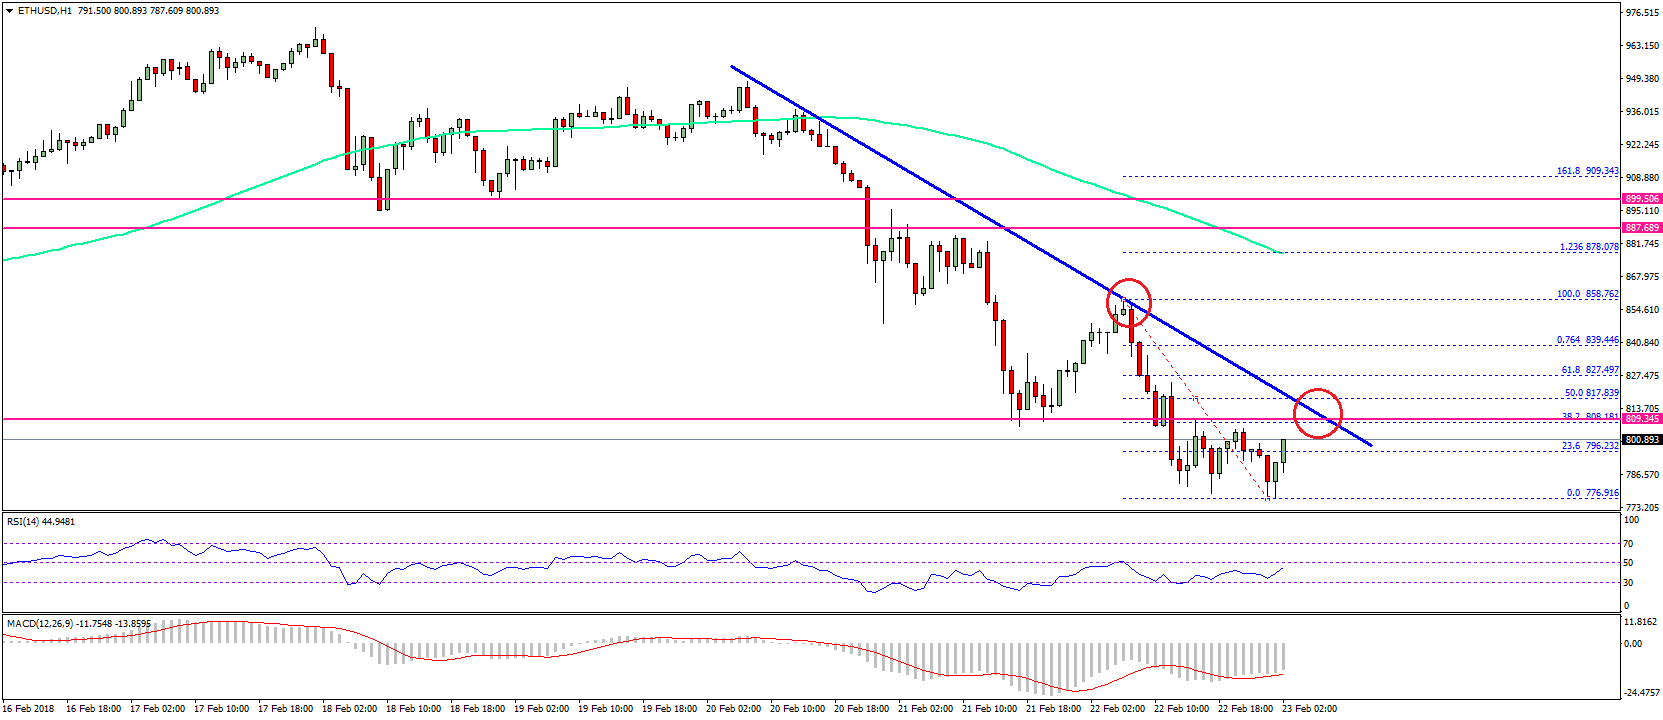
On the downside, the recent low at $776 is a key intraday support. If the price fails to stay above $776, then it could accelerate declines towards the $750 level.
Hourly MACD – The MACD is gaining pace in the bearish zone.
Hourly RSI – The RSI is correcting higher, but with no major bullish sign.
Major Support Level – $776
Major Resistance Level – $825
Charts courtesy – SimpleFX