Reason to trust

How Our News is Made
Strict editorial policy that focuses on accuracy, relevance, and impartiality
Ad discliamer
Morbi pretium leo et nisl aliquam mollis. Quisque arcu lorem, ultricies quis pellentesque nec, ullamcorper eu odio.
Key Highlights
- ETH price started a downside correction after trading towards $830 against the US Dollar.
- There was a break below a key bullish trend line with support at $805 on the hourly chart of ETH/USD (data feed via Kraken).
- The pair may correct a few points further, but it may find support near the $725-730 zone.
Ethereum price is correcting lower against the US Dollar and Bitcoin. ETH/USD remains supported above the $725 level, which is also a pivot zone.
Ethereum Price Resistance
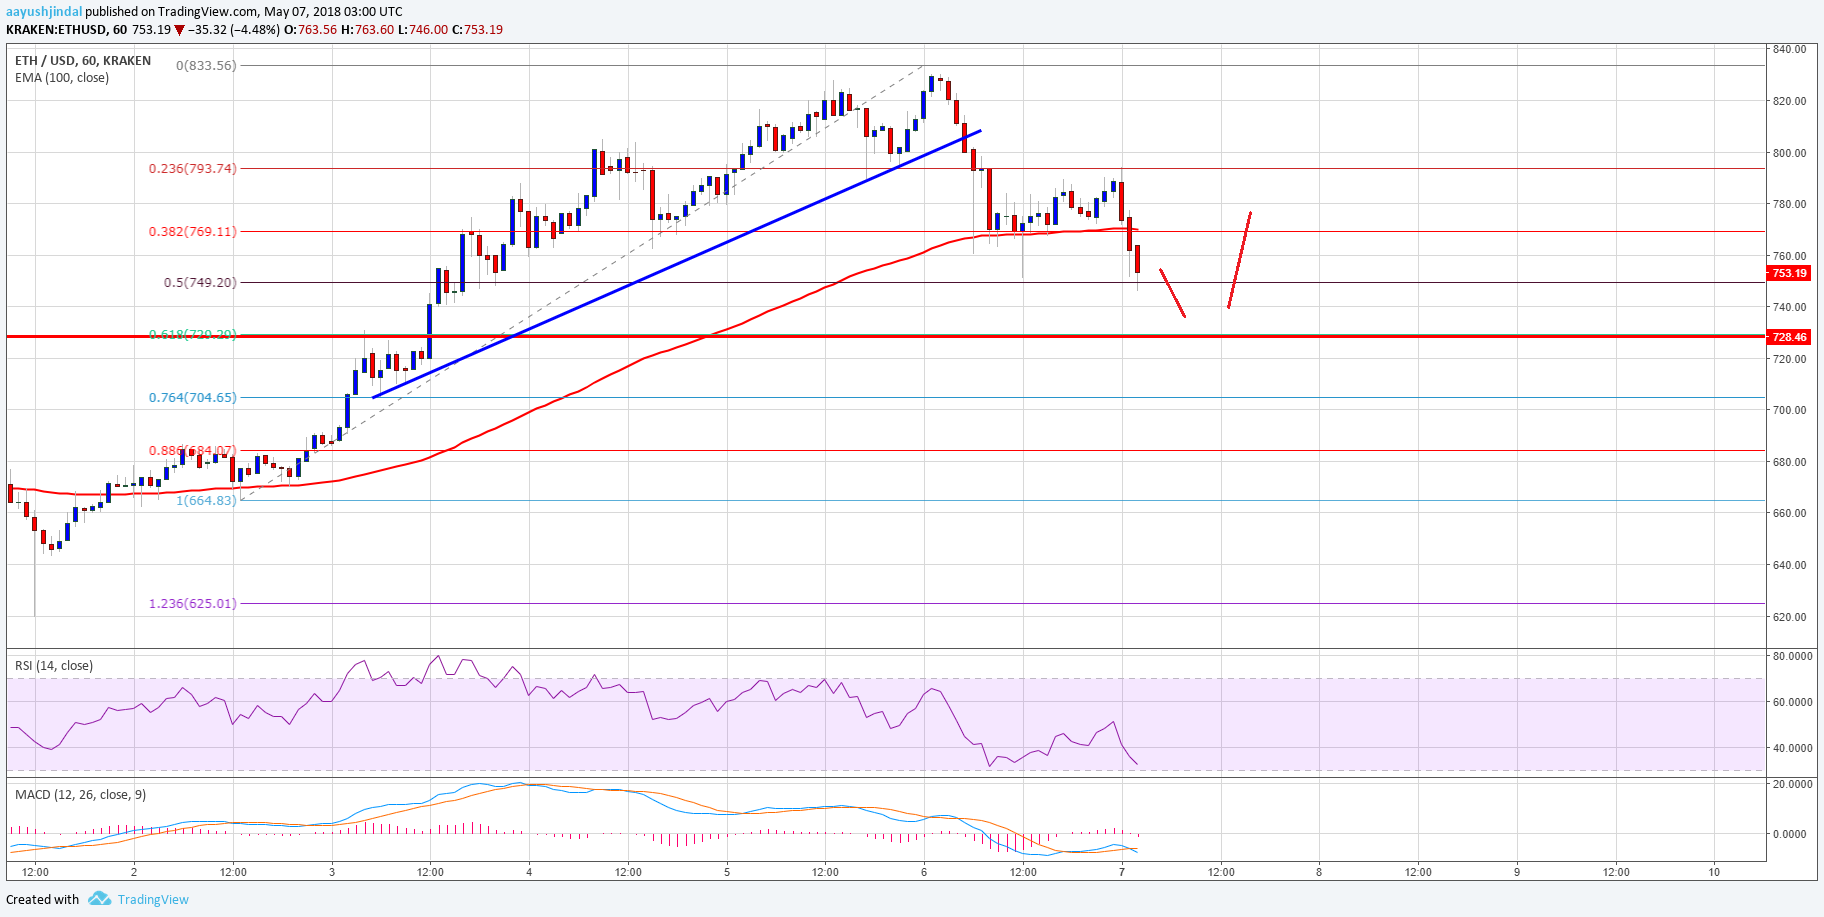
There were solid gains in ETH price above $800 this past week against the US Dollar. The price traded above the $830 level before it faced a strong resistance. Later, a downside correction was initiated and the price declined below the $800 and $780 support levels. There was also a break below the 23.6% Fib retracement level of the last wave from the $664 low to $833 high.
More importantly, there was a break below a key bullish trend line with support at $805 on the hourly chart of ETH/USD. The pair even traded below the $760 level and settled below the 100 hourly simple moving average. At the moment, the price is testing the 50% Fib retracement level of the last wave from the $664 low to $833 high. It could either bounce back or correct further towards the $725 support zone. The $725-730 area is significant and it will most likely prevent further losses in the near term.

Looking at the chart, the price is currently in a correction phase below $800. However, it must stay above the $725 support to avid an increase in selling pressure. On the upside, an initial resistance is at $760. Having said that, a break above the $770 level and the 100 hourly SMA is needed for the price to gain traction.
Hourly MACD – The MACD is now in the bearish zone.
Hourly RSI – The RSI is currently approaching the 30 level.
Major Support Level – $725
Major Resistance Level – $770


Agree with the short-term bearish sentiment of your analysis but I think it will be slightly more pronounced. There is an H&S pattern formed and we’ve recently broken the neckline which puts the bottom of this pattern at the $650 mark. But then, I expect this only to be the end of the A wave of a larger ABC correction Elliott Wave, with a brief retrace upward (B wave) and then second half of correction (C wave) which can take us back down to mid 500’s, which coincides with both the longer term trendline, and the broader Elliott Wave 2 correction area. I’m thinking target price of $500-$550 before upward momentum returns.