Key Highlights
- ETH price continued to face sellers versus the US Dollar, and may move down further.
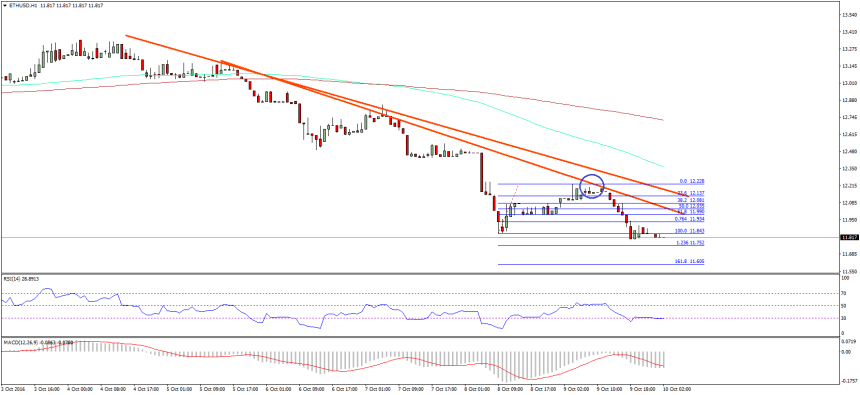
- There are two bearish trend lines formed on the hourly chart (data feed via SimpleFX) of ETH/USD, which are acting as a resistance.
- It looks like the pair may easily head towards the $11.60 level where the bulls may appear.
Ethereum price fell further, as the Eth sellers were seen in control. Going forward, there are chances of additional downsides in the short term.
Ethereum Price Resistance
Ethereum price remained under heavy selling pressure against the US Dollar this past week. I mentioned in the last couple of analysis that selling should be a preferred option in the short term. It did work, as the price after a minor correction, declined once more. There was a move towards the 23.6% Fib retracement level of the drop from the $13.34 high to $12.49 low where sellers appeared. Also, the last bearish trend line on the hourly chart acted as a perfect resistance.
Currently, there are two bearish trend lines formed on the hourly chart (data feed via SimpleFX) of ETH/USD, which may act as a hurdle on the upside. It looks like the price may decline further, and test the 1.618 extension of the last swing from the $11.84 low to $12.28 high. It represents a major technical level at 11.60, where there is a chance of buyers appearing.
I think the price has formed a short-term downtrend, and it may remain under a bearish pressure. Selling remains a preferred option until there is at least a daily close back above $12.40.
Hourly MACD – The MACD is currently in the bearish zone, and showing no signs of a recovery.
Hourly RSI – The RSI is around the oversold readings, which may produce a minor correction in the short term.
Major Support Level – $11.60
Major Resistance Level – $12.10
Charts courtesy – SimpleFX
