
Reason to trust
How Our News is Made
Strict editorial policy that focuses on accuracy, relevance, and impartiality
Ad discliamer
Morbi pretium leo et nisl aliquam mollis. Quisque arcu lorem, ultricies quis pellentesque nec, ullamcorper eu odio.
Key Highlights
- ETH price failed to gain traction and declined back towards the last swing low near $360 against the US Dollar.
- There was a break below a major ascending channel with support at $395 on the hourly chart of ETH/USD (data feed via Kraken).
- The pair is trading near the $362 and $360 support levels, and it remains at a risk of more declines.
Ethereum price is struggling to hold important supports against the US Dollar and Bitcoin. ETH/USD could even break the $360 level for more losses in the near term.
Ethereum Price Support
Yesterday, there was a tiny upside move above $400 in ETH price against the US Dollar. However, the price failed to gain traction and started a downside move from well above $405. It declined and broke the 61.8% Fib retracement level of the last upside wave from the $360 low to $417 high. It opened the doors for more losses and the price moved below the $400 level and the 100 hourly simple moving average.
During the downside, there was a break below a major ascending channel with support at $395 on the hourly chart of ETH/USD. These are negative signs below the $395 resistance. At the moment, the price is trading near the last swing low of $360. It may correct higher towards the 23.6% Fib retracement level of the last downside wave from the $418 high to $364 low. If the price fails to correct higher, it could even break the $364 low. However, a break below the $360 level could open the doors for more losses.
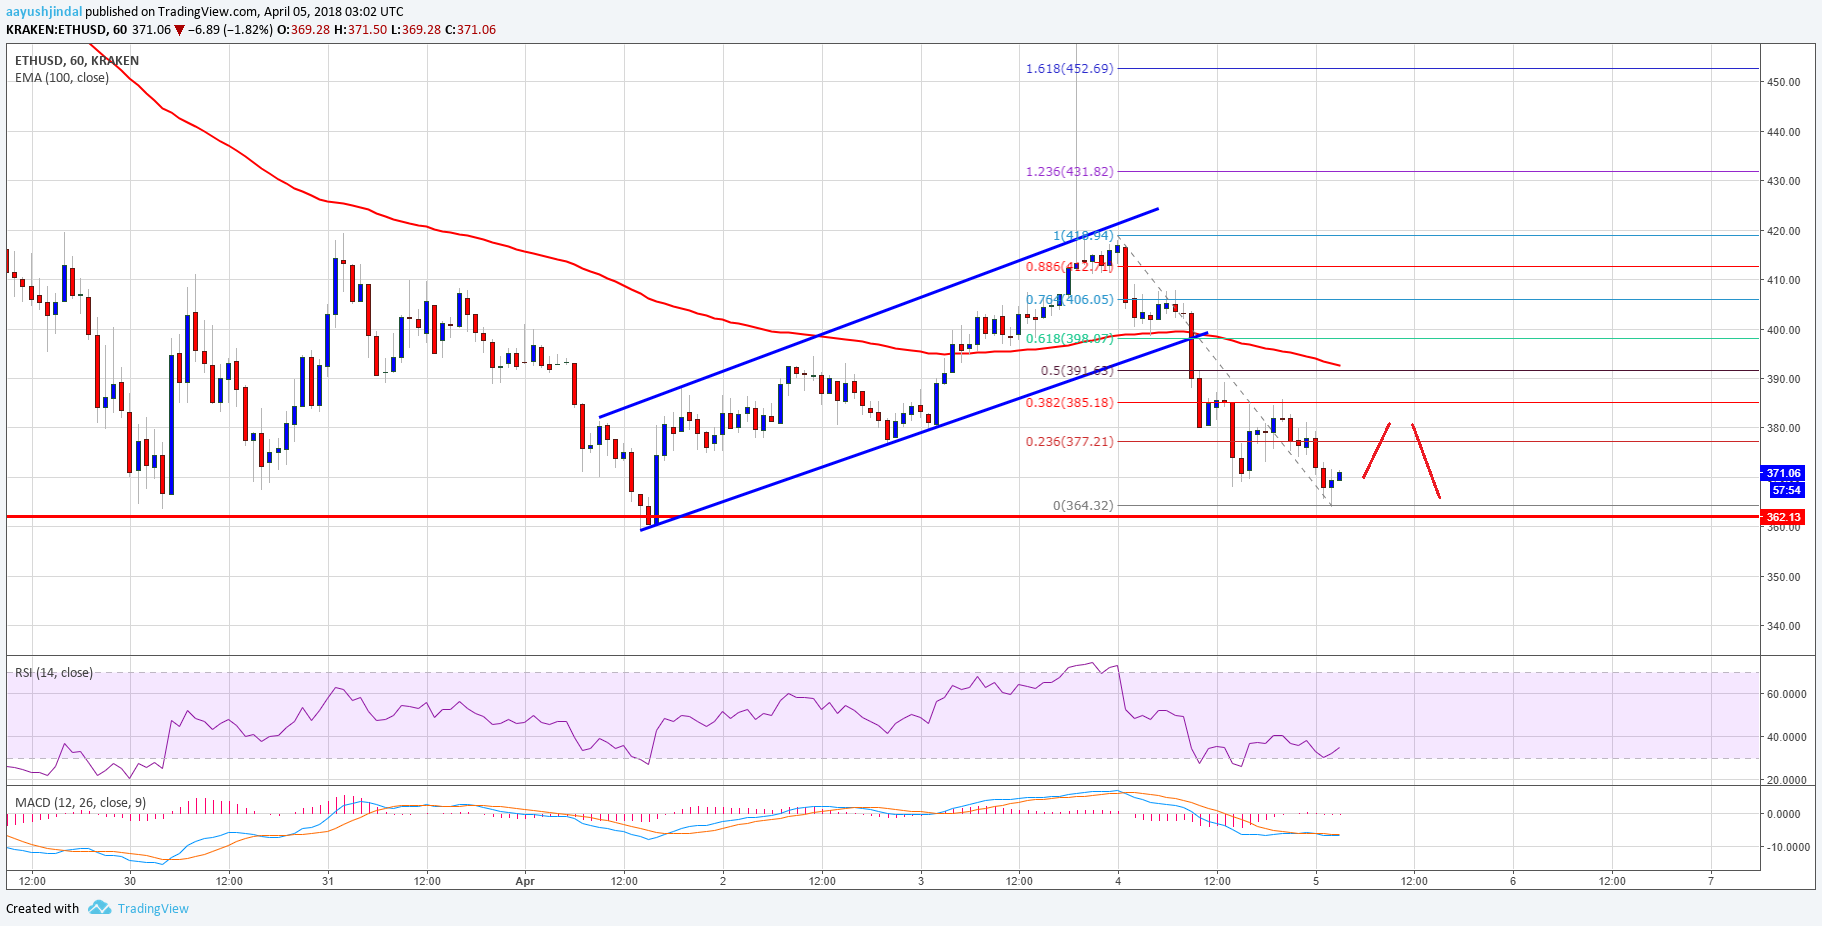
On the flip side, a break above the $395 and $400 levels is needed for a decent recovery. Above $395-400, the price could retest the last high near $418.
Hourly MACD – The MACD is attempting to move back in the bullish zone.
Hourly RSI – The RSI is now well below the 50 level.
Major Support Level – $360
Major Resistance Level – $395
Charts courtesy – Trading View


